In this post, I link to and excerpt from How To Read Patient Monitors from CardiEM, Infographics by Megan Chu. June 23, 2020.
All that follows is from the above resource.
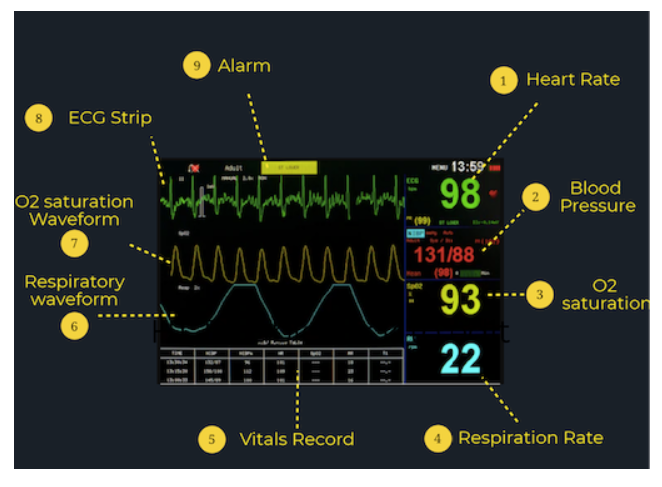
Patient monitors can be overwhelming early in your training when you’re not quite sure what you’re looking at.
Here is an example of a patient monitor. The typical layout includes the numerical vital signs on the right and the waveforms on the left, giving you a general overview of the patient’s real-time vitals.
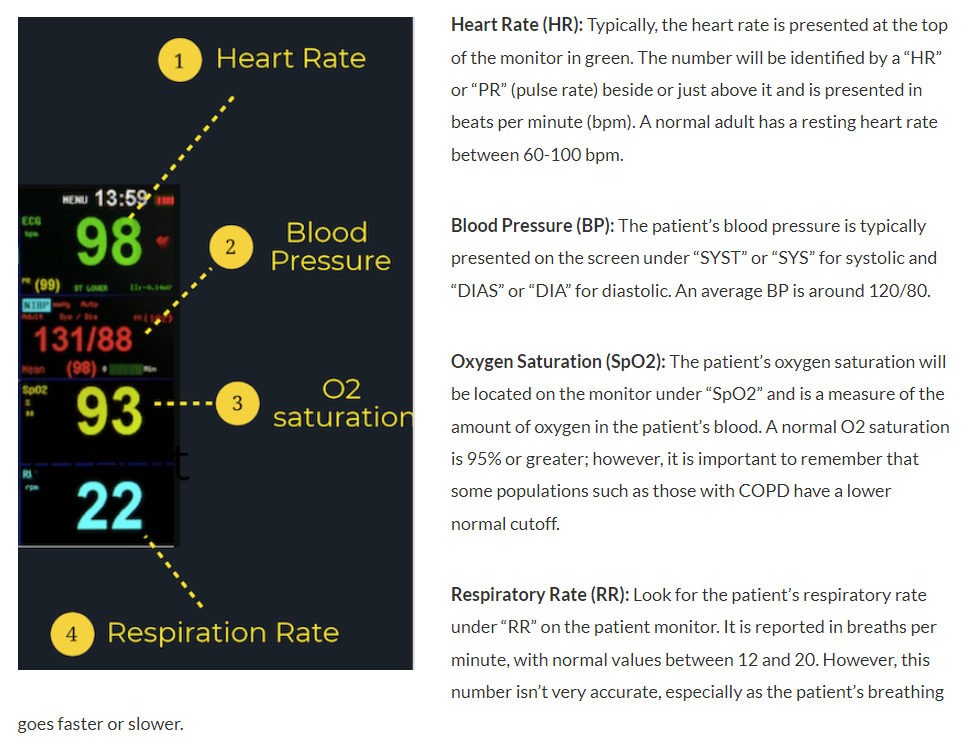
What the Numbers Mean:
Various patient monitors can record and track a wide array of information, but almost all patient monitors will record these key vital signs:
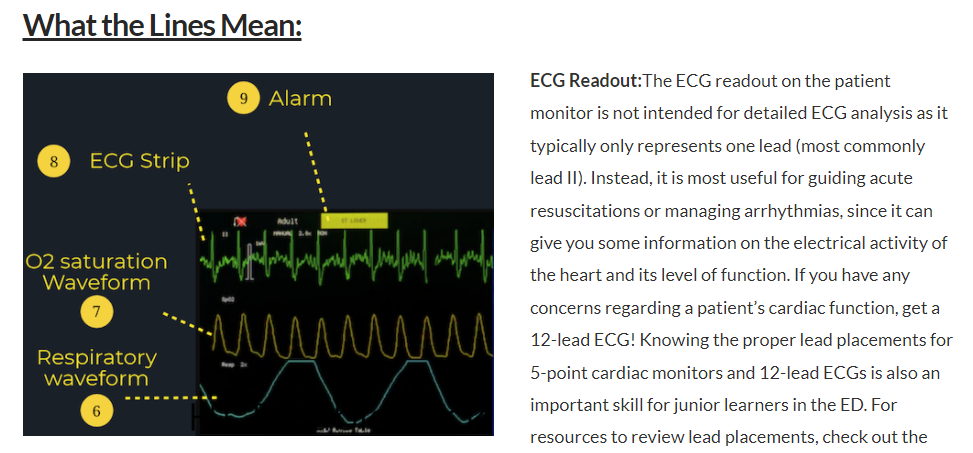
CanadiEM Frontline Primer or this blogpost by Life in the Fast Lane for an in-depth explanation.
SpO2 Waveform: The SpO2 waveform allows clinicians to determine whether there are any issues with circulation or peripheral perfusion. Each peak of the SpO2 waveform should correlate with a heartbeat on the ECG waveform at the same intervals, since oxygenated blood is being pumped out of the heart with each heartbeat.
Respiratory Waveform: The “RESP” waveform on the monitor is useful for clinicians to monitor for any respiratory issues such as apnea or dyspnea.