
Resource (1) below is an excellent (how to do it) article on how to integrate Lung Ultrasound and Echocardiography into clinical pratice for the evaluation of heart failure.
What follows are excerpts from the article:
Abstract
Ultrasound lung comets (ULCs) are a nonionizing bedside approach to assess extravascular lung water. We evaluated a protocol for grading ULC score to estimate pulmonary congestion in heart failure patients and investigated clinical and echocardiographic correlates of the ULC score. Ninety-three patients with congestive heart failure, admitted to the emergency department, underwent pulmonary ultrasound and echocardiography. A ULC score was obtained by summing the ULC scores of 7 zones of anterolateral chest scans. The results of ULC score were compared with echocardiographic results, the New York Heart Association (NYHA) functional classification, radiologic score, and N-terminal pro-b-type natriuretic peptide (NT-proBNP). Positive linear correlations were found between the 7-zone ULC score and the following: E/e′, systolic pulmonary artery pressure, severity of mitral regurgitation, left ventricular global longitudinal strain, NYHA functional classification, radiologic score, and NT-proBNP. However, there was no significant correlation between ULC score and left ventricular ejection fraction, left ventricle diameter, left ventricular volume, or left atrial volume. A multivariate analysis identified the E/e′, systolic pulmonary artery pressure, and radiologic score as the only independent variables associated with ULC score increase. The simplified 7-zone ULC score is a rapid and noninvasive method to assess lung congestion. Diastolic rather than systolic performance may be the most important determinant of the degree of lung congestion in patients with heart failure.
1. Introduction
In patients with congestive heart failure or intravascular volume overload, redistribution of fluids within the lungs leads
to pulmonary edema. Excessive extravascular lung water
(EVLW) accumulates in the interstitial and alveolar spaces,
due to elevated left ventricular (LV) filling pressures [1].Lung ultrasound is a noninvasive and nonionizing imaging technique that has been previously proposed as a bedside
tool for evaluating pulmonary congestion in patients with
heart failure [4]. Lichtenstein and Meziere [5] reported that `
multiple anterior diffuse B-lines with lung sliding indicated pulmonary edema with 97% sensitivity and 95% specificity.
2. Methods
Cardiac and lung echographic examinations were performed before intravenous diuretic therapy. All patients were
analyzed in the supine, near-to-supine, or lateral position.
An experienced operator (HL) with 8 years of echographic
examination experience and 2 years of lung ultrasound
experience performed the examinations, using Philips CX50
(Philips Ultrasound, Bothell, Washington, USA) with S5-
1 phased-array probe (1–5 MHz) and L12-3 linear probe
(3–12 MHz).2.2. Transthoracic Echocardiographic Study
All patients underwent transthoracic echocardiography examination at bedside. In accordance with the recommendations of the American Society of Echocardiography, the LV end-diastolic and end-systolic diameters (LVEDD and LVESD, resp.) were measured from the M-mode trace, obtained via a parasternal long-axis view. Left ventricular end-diastolic and end-systolic volumes (LVEDV and LVESV), ejection fraction (LVEF), and left atrial volume were obtained from 2-chamber and 4-chamber views using the biplane Simpson’s method and
indexed to body surface area. The peak Doppler velocities of early (E) and late (A) diastolic flow and the ratio of E to A (/) were measured from the apical 4-chamber view. A 1.5 mm sample volume was placed at the septal and lateral corner of the mitral annulus. An analysis was also performed for early (e’) and late diastolic velocity, and the average E/e’ ratio was calculated. The severity of mitral regurgitation was assessed semiquantitatively (i.e., mild, moderate, or severe) by color flow Doppler [15]. The systolic pulmonary artery pressure (SPAP) was calculated as the sum of the maximum systolic tricuspid regurgitation pressure gradient and the right atrial pressure. The rightatrial pressure was estimated on the basis of the diameter and inspiratory collapse index of the inferior vena cava[16]. Tricuspid annular plane systolic excursion (TAPSE) was measured by M-mode echocardiography in the apical 4-
chamber view as the longitudinal systolic excursion of the
tricuspid annulus [17]. Right ventricular dysfunction was
defined as TAPSE < 17 mm [17]. LV global longitudinal strain
(GLS) analysis* was performed offline using commercially
available software (QLAB version 10.3; Philips Ultrasound,
Seattle, USA), averaging the peak longitudinal strain of the
3 apical views. GLS data are expressed as absolute values.*Global Longitudinal Strain for LV Function Aug 10, 2018 | David S. Bach, MD, FACC
2.3. Transthoracic Lung Ultrasound
After the transthoracic echocardiography examination, all patients underwent transthoracic lung ultrasonography with the same phased array transducer. Seven zones were considered in our simplified ULC scoring method. The anterior chest wall was delineated from the sternum to the anterior axillary line andwas subdivided into upper and lower halves, from the clavicleto the diaphragm. The lateral zone was delineated from the anterior to the posterior axillary line and was subdivided
into upper and lower halves (the area above the fourth
intercostal space was defined as the upper area). We initially
adopted an 8-zone protocol, but inclusion of the anterior
lower area on the left side was subsequently removed, because most of the study population had an enlarged heart which intervened with the area. Therefore, the 7-zone protocol was adopted.The elementary findings that were evaluated were the
ULCs (also known as B-lines), defined as hyperechogenic,
vertical comet tail artifacts with a narrow base, spreading
from the pleural line to the further border of the screen
[9].According to the increasing order of severity of interstitial
or alveoli involvement, images were classified as zero, septal
syndrome, interstitial-alveolar syndrome, or white lung [18]
(Figure 2). Zero was defined as the absence of B-lines. Septal
syndrome was defined as B-lines at regular distances, corresponding to pleural projection of the subpleural septa (equal to about 7 mm). In interstitial-alveolar syndrome, B-lines
become more confluent, separated by <7 mm. White lung was
designated for B-lines that coalesced, resulting in an almost
completely white echographic lung field (confluent B-lines >
80%; Figure 2) (Videos 1–4 in Supplementary Materials). A
simplified 7-zone ULC score was then calculated according
to the grades: 0 = zero, 1 = septal syndrome, 2 = interstitial alveolar syndrome, and 3 = white lung. Each intercostal
space was examined thoroughly, and the images recorded
in each zone were those with the highest score. All clips of transthoracic lung ultrasonography were recorded and
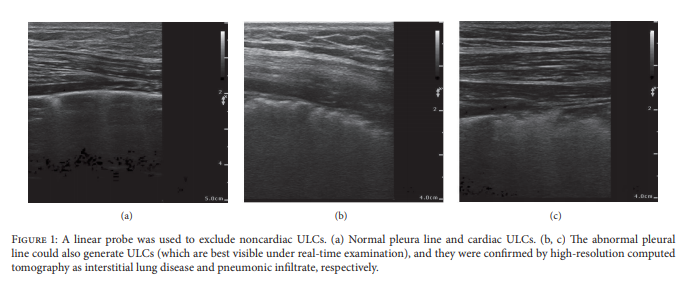
reviewed blinded to echocardiographic data.We also scanned the pleural line with a high-resolution
linear probe, to exclude pneumogenic ULCs (Videos 5–7 in
Supplementary Materials).
The above paragraph is one of the reasons it is best to have a linear probe for POCUS as well as a phased array. Also you need a linear probe if you are going to do IV access and vascular studies.

4. Discussion
The primary objective of the present study was to evaluate a
simplified protocol for scoring ULCs to estimate pulmonary
congestion in heart failure patients. This 7-zone protocol
was compared with the echocardiographic results, NYHA
functional classification, radiologic score, and NT-proBNP.
We found that the 7-zone ULC score correlated with LV
diastolic functional parameters, SPAP, GLS, the severity of
mitral regurgitation, NYHA functional classification, radiologic score, and NT-proBNP. Multivariate analysis identified
the E/e’, systolic pulmonary artery pressure, and radiologic
score as the only independent variables associated with
ULC score increase among echocardiographic results. It is
important to note that the patients enrolled in the study were
patients with heart failure and varying degrees of dyspnea.ULCs are multiple comet tails and a simple echographic
sign of EVLW [9]. Normal extravascular lung water is
<500 mL or <10 mL/kg [20, 21], while excessive EVLW leads
to interstitial and alveolar edema, that is, lung congestion
[22]. The distribution of ULCs is a reflection of the volume of pulmonary congestion [18]. When decompensated
congestive heart failure occurs, increased LV end-diastolic
pressure and left atrial pressure lead to elevated pulmonary
venous pressure and then increased hydrostatic pressure
in the pulmonary capillaries. Mild elevation of left atrial
pressure (18–25 mmHg) causes edema in the interstitial spaces and thickened subpleural interlobular septa. When
left atrial pressure rises further (>25 mmHg), the lymphatic
resorption capacity is exceeded and edema fluid breaks
through the lung epithelium and pours into the alveoli [23].
The density and distribution of ULCs will vary according
to the pathologic states described above: scattered septal
syndrome represents thickened subpleural interlobular septa.
Interstitial-alveolar syndrome and white lung are a more
severe form of interstitial lung syndrome, that is, alveolar
flooding [18]. In the latter stage, gas exchange is impaired and
dyspnea becomes more serious. Therefore, the correlation
between ULC score and severity of dyspnea, in accordance
with the NYHA functional classification, makes rational
sense.

For patients with suspected heart failure, echocardiography is an essential imaging tool that can be used to measure
LV systolic and diastolic function, estimate pulmonary capillary wedge pressure (PCWP) and SPAP, and evaluate LV
filling pressure [30]. Existing literature is sparse regarding
the association between lung congestion on lung ultrasound
and cardiac function and structure, and in most studies the
population was not restricted, or GLS assessment of LV was
not included. A previous study found a correlation between the number of B-lines and LVEF, or B-lines and the degree
of diastolic dysfunction in patients with suspected heart
failure [6]. In a study of 72 patients (53 and 19 with LV
systolic dysfunction and normal function, resp.), Agricola
et al. [31] reported a positive linear correlation between B-lines and E/e’, estimated PCWP, SPAP, and LVEF. Another
report corroborated this finding, in addition to a significant
linear correlation between B-lines and left atrial volume and
pulmonary pressure in a cohort of dialysis patients [1]. These
data are in broad agreement with the present study, in which E/e’, a surrogate marker for left-side filling pressures and
SPAP due to pulmonary venous congestion, had the strongest
association with ULCs.However, unlike the above studies, we found that the
LVEF was somewhat less informative for predicting the
degree of lung congestion. The discrepancy in results could
be due to different study populations. Ours was limited
exclusively to a cohort of identified left heart failure patients
with pulmonary congestion. In some contexts, it has been
shown that the signs and symptoms of congestive heart
failure correlate poorly with LVEF [32, 33]. Gandhi et al. [34]
proposed that, in patients with acute hypertensive pulmonary
edema, the edema was due to the exacerbation of diastolic
dysfunction, but not to systolic dysfunction. It was also
reported in a study of patients with cardiogenic pulmonary
edema detected by lung ultrasound that up to 15.4% had an
LVEF > 50%, and it was thought that diastolic dysfunction
may be the cause of pulmonary edema [29]. Actually, as a
parameter of LV systolic function, LVEF is load-dependent,
linked to the quality of imaging and LV geometry, and may
not correlate with functional status. Interestingly, although
GLS weakly correlated with ULC score in the present study,
the multivariate analysis showed no independent association. Therefore, this finding further validates that systolic
performance may not be better than the diastolic one for
determining the degree of lung congestion in patients with
heart failure.An enlarged left heart is suggestive of chronically elevated
LV filling pressure. A normal left heart volume is often noted
in patients with acute increase in LV filling pressures or
in the earliest stage of diastolic dysfunction. However, our
study population included patients with a history of chronic
heart failure; and this may be the reason for the inconsistency between left heart volume and pulmonary congestion
degree.Our conclusions are based only on imaging evaluations
and echocardiographic indices. While B-lines are thought to
reflect EVLW, there is no reference standard available to verify
the EVLW volume and left atrial pressure (LAP) by invasive
catheter.
Resources:
(1) A Simplified Ultrasound Comet Tail Grading Scoring to Assess Pulmonary Congestion in Patients with Heart Failure [PubMed Abstract] [Full Text HTML] [Full Text PDF]. Biomed Res Int. 2018 Jan 2;2018:8474839. doi: 10.1155/2018/8474839. eCollection 2018.
Supplementary Materials
Videos 1–4. Normal lung and three types of ULCs in ultrasound images which indicate increasing severity of interstitial or alveoli involvement.
Supplementary 1 [Download Link]. Video 1: Normal lung; B-lines are absent.
Supplementary 2 [Download Link]. Video 2: Septal syndrome; B-lines are scattered (about 7 mm apart) corresponding to the distance of subpleural septa.
Supplementary 3 [Download Link]. Video 3: Interstitial-alveolar syndrome; B lines are confluent.
Supplementary 4 [Download Link]. Video 4: White lung; B-lines have coalesced, resulting in an echographic lung field that is almost completely white.
Note. Classification of images is according to the distribution
of B-lines with the “highest” score in the respiratory cycle (Videos 2–4).
Videos 5–7. Linear probe was used to exclude noncardiac
ULCs (abnormal pleural line could also generate ULCs).
Supplementary 5 [Download Link]. Video 5: Normal pleura line and cardiac
ULCs.
Supplementary 6 [Download Link]. Video 6: Fringed pleural line indicates interstitial lung disease.
Supplementary 7 [Download Link]. Video 7: Irregular pleural line with microconsolidations.


