Today, I review, link to, and excerpt from The New England Journal Of Medicine‘s “Medical Imaging and Pediatric and Adolescent Hematologic Cancer Risk”. [PubMed Abstract] [Full-Text HTML] [Full-Text PDF]. N Engl J Med. 2025 Oct 2;393(13):1269-1278. doi: 10.1056/NEJMoa2502098. Epub 2025 Sep 17.
There are 101 similar articles in PubMed.
The above article has been cited by 27 articles in PubMed.
All that follows is from the above resource.
Abstract
Background
Assessing the risk of radiation-induced hematologic cancer from medical imaging in children and adolescents might support informed decisions on the use of imaging.Methods
We followed a retrospective cohort of 3,724,623 children born between 1996 and 2016 in six U.S. health care systems and Ontario, Canada, until the earliest of cancer or benign-tumor diagnosis, death, end of health care coverage, an age of 21 years, or December 31, 2017. Radiation doses to active bone marrow from medical imaging were quantified. Associations between hematologic cancers and cumulative radiation exposure (vs. no exposure), with a lag of 6 months, were estimated with the use of continuous-time hazards models.Results
During 35,715,325 person-years of follow-up (mean, 10.1 years per person), 2961 hematologic cancers were diagnosed, primarily lymphoid cancers (2349 [79.3%]), myeloid cancers or acute leukemia (460 [15.5%]), and histiocytic- or dendritic-cell cancers (129 [4.4%]). The mean (±SD) exposure among children exposed to at least 1 mGy was 14.0±23.1 mGy overall (for comparison, 13.7 mGy was the exposure from one computed tomographic [CT] scan of the head) and 24.5±36.4 mGy among children with hematologic cancer. Cancer risk increased with cumulative dose, with a relative risk (vs. no exposure) of 1.41 (95% confidence interval [CI], 1.11 to 1.78) for 1 to less than 5 mGy, 1.82 (95% CI, 1.33 to 2.43) for 15 to less than 20 mGy, and 3.59 (95% CI, 2.22 to 5.44) for 50 to less than 100 mGy. The cumulative radiation dose to bone marrow was associated with an increased risk of all hematologic cancers (excess relative risk per 100 mGy, 2.54 [95% CI, 1.70 to 3.51; P<0.001]; relative risk for 30 vs. 0 mGy, 1.76 [95% CI, 1.51 to 2.05]) and most tumor subtypes. The excess cumulative incidence of hematologic cancers by 21 years of age among children exposed to at least 30 mGy (mean, 57 mGy) was 25.6 per 10,000. We estimated that, in our cohort, 10.1% (95% CI, 5.8 to 14.2) of hematologic cancers may have been attributable to radiation exposure from medical imaging, with higher risks from the higher-dose medical-imaging tests such as CT.Conclusions
Our study suggests an association between exposure to radiation from medical imaging and a small but significantly increased risk of hematologic cancer among children and adolescents. (Funded by the National Cancer Institute and others.)Table 1Characteristics of Study Cohort and Hematologic Cancers.*
Characteristic Entire Cohort
(N=3,724,623)Person-Years of
Follow-up
(N=35,715,325)†All Hematologic Cancers
(N=2961)Country — no. (%) Canada 2,793,503 (75.0) 30,089,301 (84.2) 2487 (84.0) United States 931,120 (25.0) 5,626,024 (15.8) 474 (16.0) Sex — no. (%) Male 1,910,587 (51.3) 18,315,841 (51.3) 1722 (58.2) Female 1,814,036 (48.7) 17,399,483 (48.7) 1239 (41.8) Down’s syndrome — no. (%) Yes 4,124 (0.1) 38,154 (0.1) 110 (3.7) No 3,720,499 (99.9) 35,677,171 (99.9) 2851 (96.3) Birth cohort — no. (%) 1996 to 1999 687,580 (18.5) 11,342,544 (31.8) 865 (29.2) 2000 to 2004 903,039 (24.2) 11,337,119 (31.7) 842 (28.4) 2005 to 2009 940,931 (25.3) 8,268,078 (23.1) 723 (24.4) 2010 to 2016 1,193,073 (32.0) 4,767,584 (13.3) 531 (17.9) Age at end of follow-up — no. (%) 6 mo to <5 yr 1,019,190 (27.4) 2,503,372 (7.0) 1506 (50.9) 5 to <10 yr 953,638 (25.6) 6,577,018 (18.4) 695 (23.5) 10 to <15 yr 789,050 (21.2) 9,404,954 (26.3) 430 (14.5) 15 to <21 yr 962,745 (25.8) 17,229,980 (48.2) 330 (11.1) Mean follow-up time — yr 10.1 6.8 Cumulative radiation dose to bone marrow — no. (%) 0 mGy 1,406,262 (37.8) 8,953,308 (25.1) 1261 (42.6) >0 to <1 mGy 2,037,813 (54.7) 22,777,331 (63.8) 1428 (48.2) 1 to <5 mGy 84,380 (2.3) 1,194,532 (3.3) 77 (2.6) 5 to <10 mGy 63,552 (1.7) 1,035,818 (2.9) 38 (1.3) 10 to <15 mGy 49,614 (1.3) 615,186 (1.7) 23 (0.8) 15 to <20 mGy 35,266 (1.0) 443,659 (1.2) 45 (1.5) 20 to <30 mGy 21,360 (0.6) 301,692 (0.8) 28 (0.9) 30 to <50 mGy 17,779 (0.5) 265,994 (0.7) 31 (1.0) 50 to <100 mGy 6,462 (0.2) 96,820 (0.3) 20 (0.7) ≥100 mGy 2,135 (0.1) 30,985 (0.1) 10 (0.3) Cumulative radiation dose to bone marrow among children who received an exposure of ≥1 mGy Mean — mGy 14.0±23.1 24.5±36.4 90th percentile — mGy 28.7 55.9 Reason for end of follow-up — no. (%)‡ Hematologic cancer 2,961 (0.1) 18,765 (0.1) Other malignant or benign tumor 3,742 (0.1) 25,435 (0.1) Death 4,916 (0.1) 27,808 (0.1) Age of 21 yr 135,078 (3.6) 2,768,558 (7.8) End of health care coverage§ 611,180 (16.4) 2,476,343 (6.9) End of study follow-up 2,966,746 (79.7) 30,398,415 (85.1)
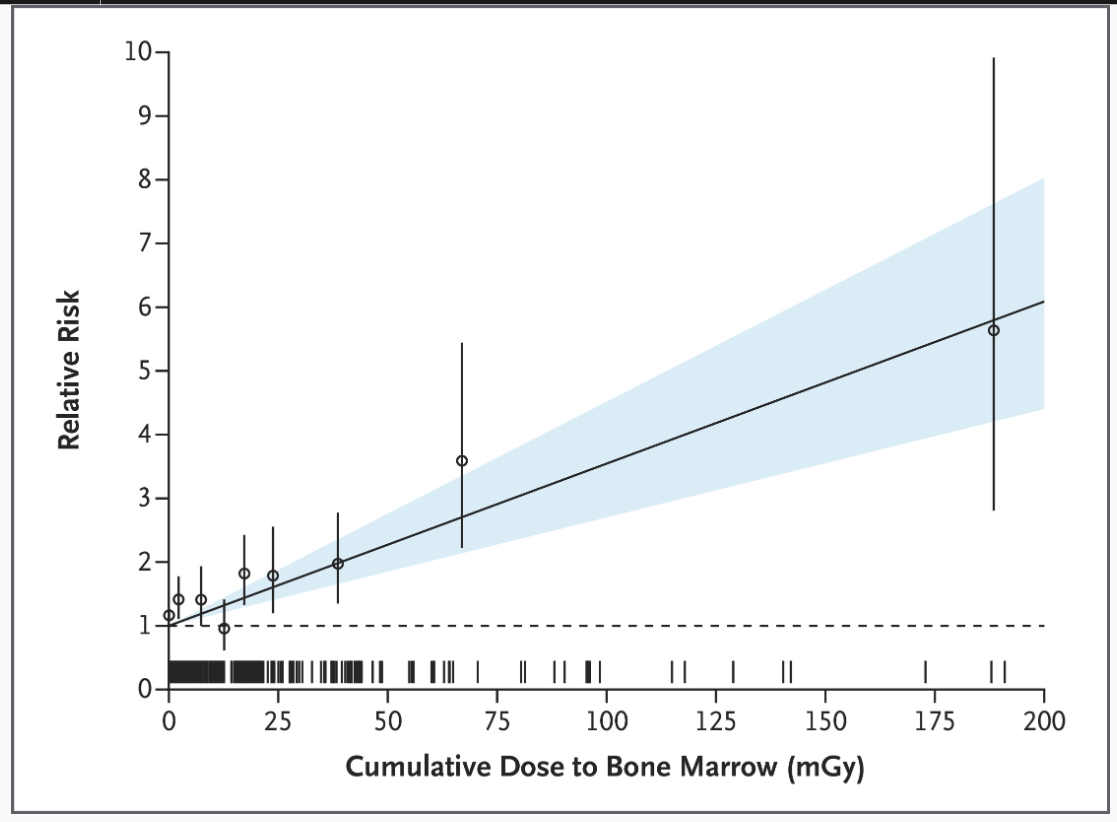
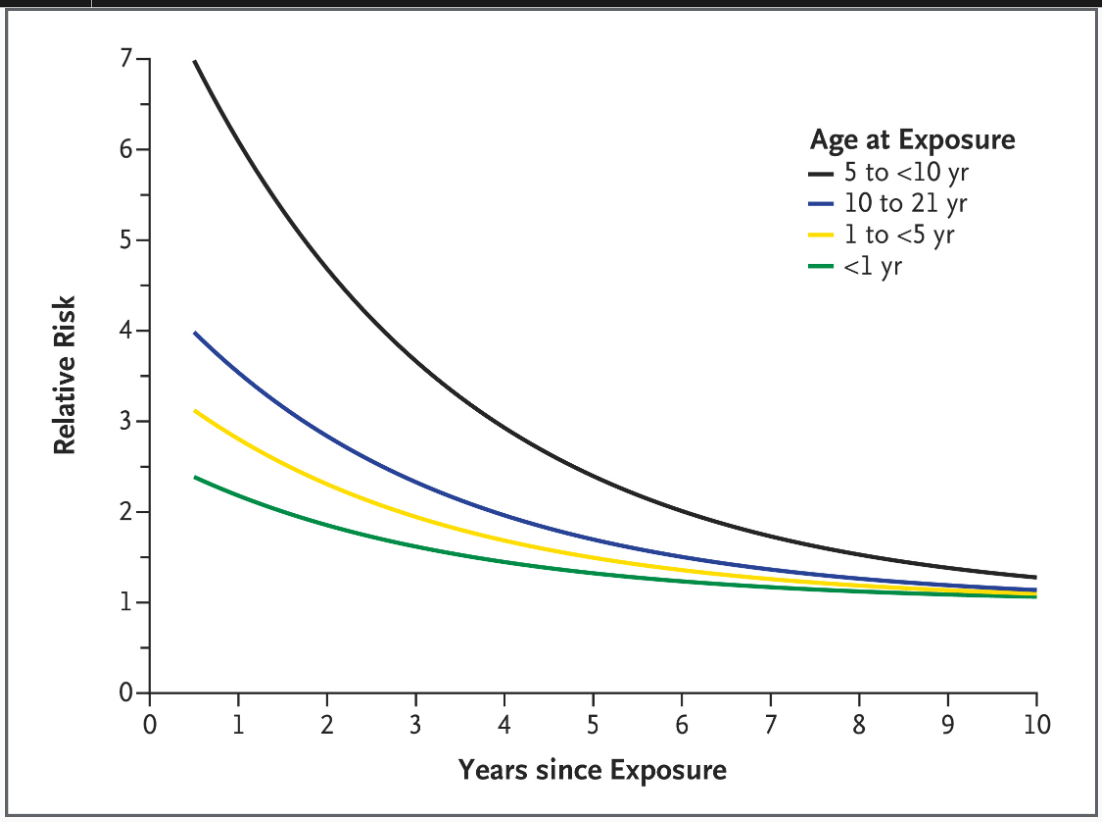
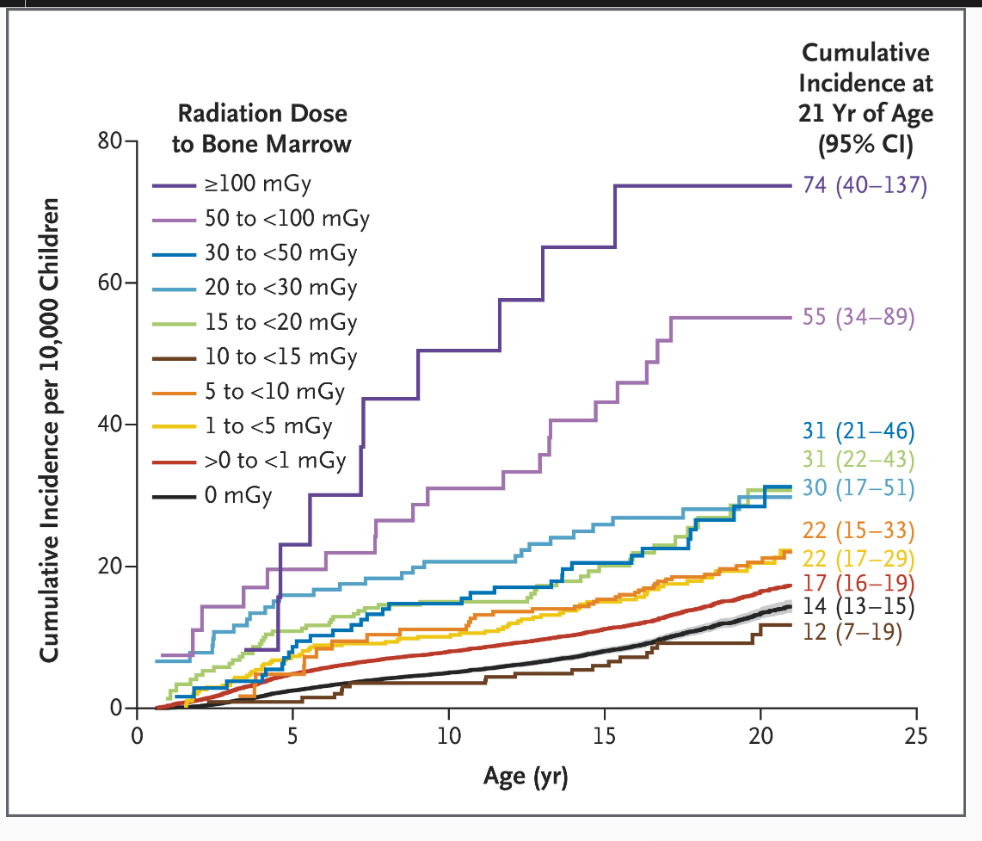
Cancer Type and Subtype No. of Cases Excess Relative Risk per 100 mGy (95% CI) Relative Risk vs. No Exposure (95% CI) 10 mGy 30 mGy 100 mGy All hematologic cancers† 2961 2.54 (1.70–3.51) 1.25 (1.17–1.35) 1.76 (1.51–2.05) 3.54 (2.70–4.51) Lymphoid cancers‡ 2349 1.95 (1.09–2.97) 1.20 (1.11–1.30) 1.59 (1.33–1.89) 2.95 (2.09–3.97) Non–Hodgkin’s lymphoma 2059 2.56 (1.52–3.81) 1.26 (1.15–1.38) 1.77 (1.46–2.14) 3.56 (2.52–4.81) Mature B-cell lymphoma 229 9.68 (5.53–15.38) 1.97 (1.55–2.54) 3.90 (2.66–5.61) 10.68 (6.53–16.38) Mature T-cell or natural-killer-cell lymphoma 76 9.26 (2.86–20.26) 1.93 (1.29–3.03) 3.78 (1.86–7.08) 10.26 (3.86–21.26) Precursor-cell lymphoma§ 1745 0.32 (>0.00–1.22) 1.03 (1.00–1.12) 1.09 (1.00–1.37) 1.32 (1.00–2.22) Hodgkin’s lymphoma§ 279 0.00 (0.00–1.10) 1.00 (1.00–1.11) 1.00 (1.00–1.33) 1.00 (1.00–2.10) Myeloid cancer or acute leukemia¶ 460 1.82 (>0.00–4.02) 1.18 (>1.00–1.40) 1.55 (>1.00–2.21) 2.82 (>1.00–5.02) AML, related precursor neoplasm, ALMP, or ALAP§‖ 304 0.00 (0.00–1.49) 1.00 (1.00–1.15) 1.00 (1.00–1.45) 1.00 (1.00–2.49) Myeloproliferative or myelodysplastic syndrome 124 10.19 (3.61–20.82) 2.02 (1.36–3.08) 4.06 (2.08–7.24) 11.19 (4.61–21.82) Histiocytic- or dendritic-cell cancer 129 20.01 (10.00–35.71) 3.00 (2.00–4.57) 7.00 (4.00–11.71) 21.01 (11.00–36.71) *ALAP denotes acute leukemia of ambiguous lineage, ALMP acute leukemia of mixed phenotype, and AML acute myeloid leukemia.†The data include 23 tumors of unspecified type.‡This category includes acute lymphoid leukemia. The data include 11 lymphoid tumors that could not be classified as non-Hodgkin’s lymphoma or Hodgkin’s lymphoma.§The lower boundary of the confidence interval was constrained to 0 for the excess relative risk and 1 for the relative risk.¶The data for myeloid cancer or acute leukemia include 32 tumors that could not be classified into subtypes.‖Leukemias in the myeloid group refer to nonlymphoid leukemias.Figure 1Relative Risks for All Hematologic Cancers According to Cumulative Radiation Dose to Bone Marrow.Relative Risks for All Hematologic Cancers According to Cumulative Radiation Dose to Bone Marrow.Dots show estimated relative risks according to categories of cumulative dose (see Table S3 in Supplementary Appendix 2). Vertical bars show 95% confidence intervals. The solid line represents the fitted dose–response relation from the linear model (excess relative risk, 2.54 per 100 mGy exposure). The shaded area represents the upper and lower confidence intervals for the dose–response relation (95% confidence interval for excess relative risk, 1.70 to 3.51). The dashed horizontal line represents the reference value (relative risk, 1.0). The vertical lines at the bottom of the figure show the cumulative doses for children with a hematologic cancer, excluding two children with doses of more than 200 mGy.Figure 2Relative Risk of Hematologic Cancer for a Dose of 30 mGy (vs. No Exposure), According to Time since Exposure and Age at Exposure.Relative Risk of Hematologic Cancer for a Dose of 30 mGy (vs. No Exposure), According to Time since Exposure and Age at Exposure.Time since exposure is modeled as a continuous variable, and age at exposure is modeled as a categorical variable. Results for other dose exposures are shown in Table S5 in Supplementary Appendix 2.Figure 3Cumulative Incidence of Hematologic Cancer According to Attained Age and Radiation Dose to Bone Marrow among Children without Down’s Syndrome.Cumulative Incidence of Hematologic Cancer According to Attained Age and Radiation Dose to Bone Marrow among Children without Down’s Syndrome.The cumulative incidence and 95% confidence interval are shown for an age of 21 years. The shaded gray area represents the 95% confidence interval for the no-exposure (0 mGy) group. Confidence bands for other groups are omitted for readability.In the United States, more diagnostic imaging per capita is performed, particularly computed tomography (CT), than in any other country.1 Although essential for diagnosis and disease management, most imaging involves ionizing radiation, a known carcinogen. Extensive evidence shows a dose–response relation between radiation exposure and cancer risk.2-8 CT, owing to its frequency and relatively high doses, is the leading source of radiation exposure from medical imaging.9-11Children are especially susceptible to radiation-induced cancer because of higher radiosensitivity and longer life expectancy than adults.12 The highest risk from radiation exposure is that of hematologic cancers, the most common childhood cancers.13,14 International studies, including the European EPI-CT study, have linked childhood CT to increased risk of hematologic cancers, showing a 50% higher risk among children undergoing two or three CT scans than among those undergoing one scan.8,15,16 However, research is lacking with respect to these risks in North America or with respect to radiation exposure from radiography, fluoroscopy, angiography, or nuclear medicine. Here, we report results from the Risk of Pediatric and Adolescent Cancer Associated with Medical Imaging (RIC) retrospective cohort study to quantify the association between cumulative radiation dose to active bone marrow from medical imaging and the risk of hematologic cancers among children in the United States and Ontario, Canada.Discussion
In this retrospective cohort study involving more than 3.7 million children born in the United States or Ontario, Canada, we found a significant dose–response relation between cumulative radiation dose to bone marrow and hematologic cancer risk. Exposures that were associated with increased risk are common in clinical practice. For example, a 15-to-30-mGy exposure equivalent to one to two CT scans of the head24-27 was associated with an increased risk by a factor of 1.8, rising to a factor of 3.6 for exposures of 50 to less than 100 mGy (Table S3 in Supplementary Appendix 2). The excess cumulative incidence of hematologic cancers by 21 years of age was 25.6 per 10,000 among children exposed to at least 30 mGy and 40.8 per 10,000 among those exposed to 50 to 100 mGy. Excess risks were consistent across most subtypes of hematologic cancer and were robust to sensitivity analyses.In our cohort of children and adolescents, we estimated that medical imaging was associated with 10.1% of hematologic cancers, with attributable risks varying according to imaging type. For example, among children who underwent CT of the head, a quarter of hematologic cancers were estimated to be attributable to radiation exposure,* [emphasis added] whereas among children undergoing radiography, such as for a broken bone or pneumonia, a very small percentage (<1%) of hematologic cancers were estimated to be associated with radiation exposure (Table S6 in Supplementary Appendix 2). Although CT and other radiation-based imaging techniques may be lifesaving, our findings underscore the importance of carefully considering and minimizing radiation exposure during pediatric imaging to protect children’s long-term health. Furthermore, our results quantify the risk of cancer associated with medical imaging through 21 years of age, but cumulative incidence will probably increase with longer follow-up. Research on Japanese atomic-bombing survivors showed that leukemia rates peaked 6 to 8 years after exposure, with excess risk lasting for more than five decades, particularly for acute myeloid leukemia.4,12,28
*