
Note to myself: Whenever I review today’s awesome resource I need to also review Dr. Weingart’s related podcast: EMCrit 367 – Panel: 4 Quadrant Hemodynamic Ultrasound Integration, IVC Ultrasound and Much More!
January 27, 2024 by Scott Weingart, MD FCCM
In addition to today’s resource, please review:
- Link To POCUS Assessment Of Venous Congestion, Grand Rounds By Dr. Philippe Rola (VExUS)
Posted on September 23, 2021 by Tom Wade MD from- Mayo Clinic Critical Care Grand Rounds: VExUS from @ThinkingCC / CCUS Institute on Vimeo.Here is the Vexus score chart from the above resource: Remember that Dr. Rola reminds us to evaluate the IVC diameter in both the long and the short-axis view.
The VExUS Score:
- Mayo Clinic Critical Care Grand Rounds: VExUS from @ThinkingCC / CCUS Institute on Vimeo.Here is the Vexus score chart from the above resource: Remember that Dr. Rola reminds us to evaluate the IVC diameter in both the long and the short-axis view.
Today, I link to, and excerpt from Unifying Fluid Responsiveness and Tolerance With Physiology: A Dynamic Interpretation of the Diamond-Forrester Classification. [PubMed Abstract] [Full-Text HTML] [Full-Text PDF]. Jon-Émile S Kenny 1 2, Ross Prager 3, Philippe Rola 4, Korbin Haycock 5, John Basmaji 3, Glenn Hernández 6. Crit Care Explor. 2023 Dec 12;5(12):e1022. doi: 10.1097/CCE.0000000000001022. eCollection 2023 Dec.
All that follows is from the above outstanding resource.
Abstract
Point of care ultrasound (POCUS) is a first-line tool to assess hemodynamically unstable patients, however, there is confusion surrounding intertwined concepts such as: “flow,” “congestion,” “fluid responsiveness (FR),” and “fluid tolerance.” We argue that the Frank-Starling relationship is clarifying because it describes the interplay between “congestion” and “flow” on the x-axis and y-axis, respectively. Nevertheless, a single, simultaneous assessment of congestion and flow via POCUS remains a static approach. To expand this, we propose a two-step process. The first step is to place the patient on an ultrasonographic Diamond-Forrester plot. The second step is a dynamic assessment for FR (e.g., passive leg raise), which individualizes therapy across the arc of critical illness.
Copyright © 2023 The Authors. Published by Wolters Kluwer Health, Inc. on behalf of the Society of Critical Care Medicine.
BACKGROUND
Enhancing organ perfusion without congestion is paramount during hemodynamic resuscitation in the ICU (1). Although tissue perfusion depends on several variables, such as flow distribution and status of the microcirculation, the first resuscitative step is to augment macrohemodynamic flow (i.e., stroke volume, SV) with IV fluids. Yet, overzealous IV fluid administration can cause venous hypertension which, in conjunction with inflamed and leaking capillary beds, may lead to organ injury (2).
Assessing Flow and Congestion With Doppler Ultrasound
Historically, flow and venous hypertension (i.e., “congestion”) were assessed by history and examination, supplemented by biochemistry, radiography, and invasive hemodynamic monitors (3). Due to its portability, safety profile, and increased availability, point-of-care ultrasound (POCUS) is now a first-line tool to assess flow and congestion (3–5).
Many POCUS resuscitation protocols use 2D echocardiography to phenotype the etiology of shock; however, these approaches have shortcomings rooted in misconceptions about clinical hemodynamics. For instance, clinicians may associate a collapsing inferior vena cava (IVC) with hypovolemia or a normal/high ejection fraction with fluid responsiveness (FR) (6).
Given these concerns, clinicians are increasingly adopting hemodynamic echocardiography to measure the left ventricular outflow tract velocity time integral (LVOT VTI) as a surrogate for SV (7,8). Ascertaining absolute SV helps define the etiology of shock. For example, hypotension with high SV suggests pathologic vasodilation, whereas a low SV intimates volume loss, venodilation, cardiac dysfunction, or some combination thereof. Importantly, however, absolute SV does not predict how the heart will respond to any particular intervention, especially IV fluid. In other words, SV is a static measure (9).
To predict the effect of IV fluid, the concept of FR has emerged (10). FR is an increase in SV or cardiac output of at least 10–15% with preload administration (11). Although FR best predicts the intended effect of IV fluid, FR-based resuscitation ignores organ congestion.
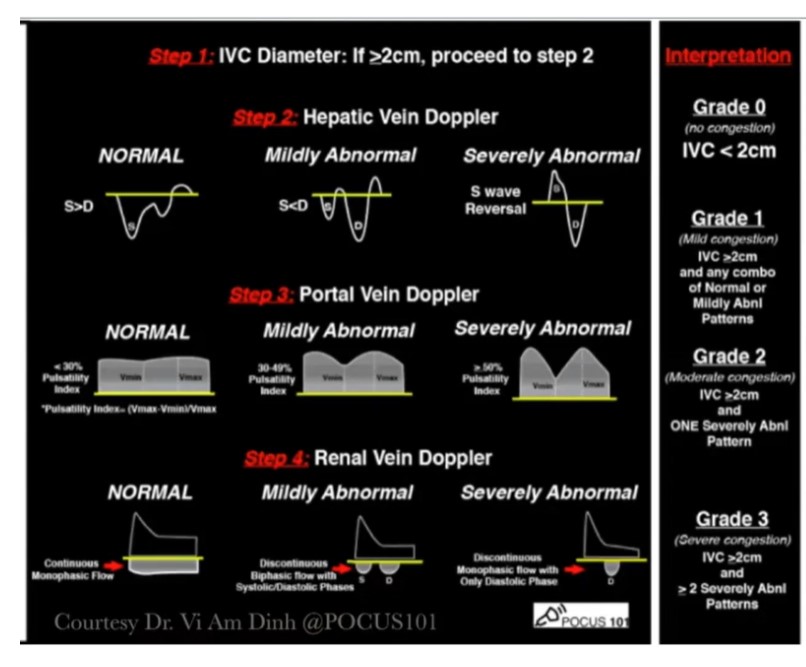
The venous excess ultrasound score (VExUS)* reveals additional, important hemodynamic data during resuscitation (12). Briefly, VExUS integrates the size of the IVC and the patterns of venous Doppler in the portal, intrarenal and hepatic veins to grade venous hypertension, which correlates with pathologically elevated Pra (13,14). Importantly, patients with low VExUS may not be fluid-responsive. The combination of normal venous pressure and fluid unresponsiveness is termed “dynamic fluid intolerance” because venous congestion is uncovered with a dynamic maneuver such as a passive leg raise (PLR) (6,15). When dynamic fluid intolerance is present, venous congestion is initially absent, but develops with fluid loading (15). Accordingly, resuscitation protocols that focus only on static venous measures are limited.
*Link To POCUS Assessment Of Venous Congestion, Grand Rounds By Dr. Philippe Rola
Posted on September 23, 2021 by Tom Wade MD
UNIFYING FRAMEWORK
To simplify the competing concepts of fluid tolerance and FR, we emphasize two principles when evaluating flow (e.g., LVOT VTI) and congestion (e.g., VExUS). First, flow and congestion are measured with reference to each other and second, flow and congestion are measured as a dynamic paradigm.
The Frank–Starling relationship inherently links the concepts of “congestion” (i.e., cardiac filling) on the x-axis and “flow” (i.e., cardiac output or SV) on the y-axis. More specifically, VExUS dichotomizes a patient into low (i.e., VExUS 0 or 1) or high (i.e., VExUS 2 or 3) “congestion,” and the LVOT VTI dichotomizes a patient into normal (i.e., LVOT VTI of ≥ 18 cm) or low (i.e., LVOT VTI < 18 cm) “flow.” With this, a patient is placed into one of four hemodynamic quadrants (Fig. 1), recapitulating the classic Diamond–Forrester hemodynamic profiles first described using the pulmonary artery catheter in 1976 (16). This first step suggests both etiology of shock and therapy, nevertheless, it remains a static approach. As discussed below, if preload is considered appropriate after this first step, we recommend a dynamic assessment of FR.
HEMODYNAMIC PROFILES
Nearly 50 years ago, Forrester et al (16) described four hemodynamic profiles in patients following acute myocardial infarction. They did so by dichotomizing both left ventricular preload and cardiac index. Preload was split into “low” and “high” based on a pulmonary artery occlusion pressure (Ppao) of 18 mm Hg, and cardiac index was dichotomized into “normal” and “low” based on a threshold of 2.2 L/min/m2. Therefore, four profiles were described: type 1 defined as normal CI, low Ppao (i.e., “warm-dry [17]”), type 2 defined as normal CI and high Ppao (i.e., “warm-wet”), type 3 defined as low CI and low Ppao (i.e., “cold-dry”) and, finally, type 4 defined by low CI and high Ppao (i.e., “cold-wet”).
More recently, Kim et al (18) retrospectively reviewed 4563 patients admitted to the cardiac ICU and determined their Diamond–Forrester phenotype based on echocardiography. They did so by using LVOT VTI to calculate CI and the ratio of the mitral valve E velocity to medial mitral annulus e′ velocity (E/e′) of 14 to estimate Ppao. With this, they observed in-hospital mortality rates of 2.9%, 7.3%, 7.1%, and 14% for profiles 1—4, respectively.
Although the Diamond–Forrester profile pertains to patients with primary cardiac pathophysiology and predicts outcomes, we believe this approach is useful during the acute resuscitation of any hemodynamically unstable patient. This is because the quadrant (or profile) into which the patient falls during resuscitation immediately suggests both an underlying etiology and treatment. Additionally, this framework also determines which patients need a dynamic assessment, for example, when IV fluids are considered.
Profile 1
In the healthy state, most people will fall into profile 1 (i.e., “warm-dry”) with normal cardiac index and low filling pressure. For the purposes of this discussion, we focus on the acutely hypotensive patient. Also, rather than measuring CI, we dichotomize flow based on SV (i.e., estimated via the LVOT VTI) because preload increases SV and reflexively decreases heart rate, which blunts the effect on CI (11). Profile 1 is defined by an LVOT VTI at least 18 cm and a VExUS of 0 or 1. The LVOT VTI value is borrowed from a separate resuscitation algorithm (8), whereas the VExUS is taken from our research showing that all healthy volunteers had a VExUS of zero or 1 in three different preload conditions (19), consistent with data in patients (14,20).
A hypotensive or hypoperfused patient in profile 1 suggests arterial vasodilation that warrants first-line vasopressor therapy (e.g., norepinephrine). This profile is comparable to the hypotensive patient with wide pulse pressure, as pulse pressure is a rough surrogate of SV. After therapy, we recommend repeating LVOT VTI and VExUS to assess for profile change. For example, if after starting norepinephrine the patient moves from profile 1 to 2 (or 4), worsened cardiac function (i.e., increased congestion with diminished flow) is implied, and inotropic support might be appropriate. If the treating clinician decides to give IV fluids, profile 1 makes FR more likely given the general shape of the Frank–Starling curve. Nevertheless, testing for FR is still recommended in patients at risk for fluid overload or other signs of fluid intolerance (e.g., b-lines on ultrasound, diastolic dysfunction, valvulopathies, increased intra-abdominal pressure, etc.).
Profile 2
An LVOT VTI of at least 18 cm but with signs of venous congestion (i.e., VExUS 2 or 3) follows the “warm-wet” Diamond–Forrester profile. In the acutely hypotensive patient in profile 2, the prospect of peripheral vasodilation should be entertained. Therefore, first-line norepinephrine is a rational, empirical approach. If hypotension is reversed and there is no profile change, but signs of hypoperfusion remain (e.g., kidney injury), then diuresis (i.e., “decongestion”) might be attempted to improve tissue perfusion. Even when fluid removal is considered in profile 2, we recommend testing for FR because this predicts the likelihood that the diuresis will reduce blood flow (and pressure). More concretely, a fluid-unresponsive patient in profile 2 will better tolerate decongestion than a fluid-responsive one (21). Another practical example of this physiology is that of weaning-induced pulmonary edema (22). With diuresis, reducing congestion until FR re-emerges could predict successful liberation from mechanical ventilation (22).
Profile 3
A low LVOT VTI without venous congestion (i.e., VExUS 0 or 1) compares to the “cold-dry” profile described by Diamond and Forrester. Although this profile was uncommon in the cardiac ICU (18), we suspect that this varies by clinical context. For instance, profile 3 is probably common early in the course of sepsis, especially in the emergency department. Although having both low VExUS and LVOT VTI might be explained by hypovolemia and reflexively rectified with IV fluids, this phenotype could be due to septic venodilation coupled with acute diastolic dysfunction. Figure 1 shows two patients in profile 3. Resuscitating a patient with an upright Frank–Starling curve (i.e., patient 1) enhances SV (e.g., LVOT VTI) with minimal congestion (e.g., VExUS). Conversely, resuscitating a patient with an abnormal, flattened Frank–Starling curve (i.e., patient 2) causes venous hypertension without benefitting systemic flow. Patient 2, in particular, illustrates why low filling pressure is commonly associated with fluid unresponsiveness, as observed in both IVC collapse and central venous pressure data (6). Therefore, a dynamic assessment in profile 3 is critical. Unresponsiveness in this quadrant early in sepsis might benefit from prompt vasoactive infusions (e.g., norepinephrine) and time for antibiotics to quell the inflammatory response.
Profile 4
This quadrant is defined by both venous congestion and low LVOT VTI and corresponds to the “cold-wet” profile. Although hypotensive patients found in this quadrant can be fluid-responsive, they are likely to have primary pump dysfunction. Therefore, before giving preload, cardiac pathology should be assessed and addressed. Complete echocardiographic evaluation for failure of one or both ventricles must occur followed by treatment of the primary pathophysiology. For example, a patient with this profile could have septic cardiac dysfunction for which an inotrope may be helpful. If, after treating the underlying cause of pump dysfunction, the patient remains hypotensive or has signs of persistent hypoperfusion (e.g., kidney injury, prolonged capillary refill), we recommend reprofiling the patient, anticipating that the VExUS falls and LVOT VTI rises (i.e., the patient moves toward profile 1). If the patient continues to have a “congested” profile (i.e., 2 or 4), then volume removal is considered. As with profile 2, testing for FR in quadrant 4 predicts the effect of volume removal (21,22).
CONCLUSIONS
Although dynamic measures are superior to static measures for assessing FR, resuscitating based only on FR ignores early signs of venous hypertension or “organ congestion.” Historically, organ congestion was assessed by cardiac filling pressure such as the central venous or pulmonary artery occlusion pressures. More recently, Doppler ultrasonography is used to assess congestion (i.e., fluid “intolerance”) noninvasively. Resuscitation grounded only on the fluid tolerant–intolerant dichotomy ignores patients who may be fluid-unresponsive. We argue that the fluid tolerance–intolerance and responsive-unresponsive dichotomies are unified by the canonical Frank–Starling relationship. Simultaneous assessment of preload (e.g., VExUS) and SV (e.g., LVOT VTI) places a patient on an ultrasonographic Diamond–Forrester plot. This framework provides immediate insight into the etiology of hemodynamic instability and suggests therapy. If IV fluid is considered after this first step, a dynamic assessment is helpful, especially in patients with signs of low filling pressure.


