
In this post I link to and excerpt from “What is an ROC curve?” [PubMed Abstract] [Full Text HTML] [Full Text PDF]. Emerg Med J. 2017 Jun;34(6):357-359.
The above article has been cited by 20 articles in PubMed.
Here are excerpts:
Abstract:
The paper by Body et al is concerned with the evaluation of decision aids, which can be used to identify potential acute coronary syndromes (ACS) in the ED. The authors previously developed the Manchester Acute Coronary Syndromes model (MACS) decision aid, which uses several clinical variables and two biomarkers to ‘rule in’ and ‘rule out’ ACS. However, one of the two biomarkers (heart-type fatty acid bindingprotein, H-FABP) is not widely used so a revised decision aid has been developed (Troponin-only Manchester Acute Coronary Syndromes, T-MACS), which include a single biomarker hs-cTnT. In this issue, the authors show how they derive a revised decision aid and describe its performance in a number of independent diagnostic cohort studies. Decision aids (as well as other types of ‘diagnostic tests’) are often evaluated in terms of diagnostic testing parameters such as the area under the receiver operating characteristic (ROC) curve, sensitivity and specificity. In this article, we explain how the ROC analysis is conducted and why it is an essential step towards developing a test with the desirable levels of sensitivity and specificity.
Introduction
Making a diagnosis is an important role for clinicians, and often a range of tests are used to supplement history-taking and examination. However, not all diagnostic tests are equal, hence it is important to evaluate the diagnostic abilities of those tests.
What physicians want to know is whether a specific condition is present, or not present. Diagnostic tests can produce either yes/no answers (binary results) or a number on a continuous scale. In the diagnosis of deep vein thrombosis (DVT), for example, Doppler ultrasound would produce a binary result (DVT present or absent). However, the serum D-dimer level used to detect DVT gives a number in a range of possible values. Diagnostic tests that produce continuous results are often dichotomised because the outcome of interest is generally binary. An example would be the threshold (or cut-off point) of 500 μg/L to distinguish between a ‘positive’ and a ‘negative’ D-dimer result.1
One of the challenges in interpreting the results of diagnostic tests that produce continuous measures is the selection of the threshold to distinguish a ‘positive’ test from a ‘negative’ test. We used the paper by Body et al 2 as an example to illustrate the role of receiver operating characteristic (ROC) curve in choosing the threshold cut-offs for the newly derived Troponin-only Manchester Acute Coronary Syndromes (T-MACS) score. The original Manchester Acute Coronary Syndromes (MACS) score used two thresholds to aid clinical decision making. A low threshold was set to ‘rule out’ a diagnosis of acute coronary syndromes (ACS) and a higher threshold was used to ‘rule in’ a diagnosis of ACS. Patients with test results falling between these two thresholds would require further clinical observation. The T-MACS (and the original MACS) score estimate the probability of ACS from 0 (lowest probability) to 1 (highest probability).
Generating an ROC curve
To produce an ROC curve, the sensitivities and specificities for different values of a continuous test measure are first tabulated. This results, essentially, in a list of various test values and the corresponding sensitivity and specificity of the test at that value.
Then, the graphical ROC curve is produced by plotting sensitivity (true positive rate) on the y-axis against 1–specificity (false positive rate) on the x-axis for the various values tabulated.Using an ROC curve to understand the diagnostic
value of a testAn ROC curve that follows the diagonal line y=x produces false positive results at the same rate as true positive results. Therefore, we expect a diagnostic test with reasonable accuracy to have an ROC curve in the upper left triangle above the y=x
line (‘reference line’), as shown in figure 1.Figure 1:
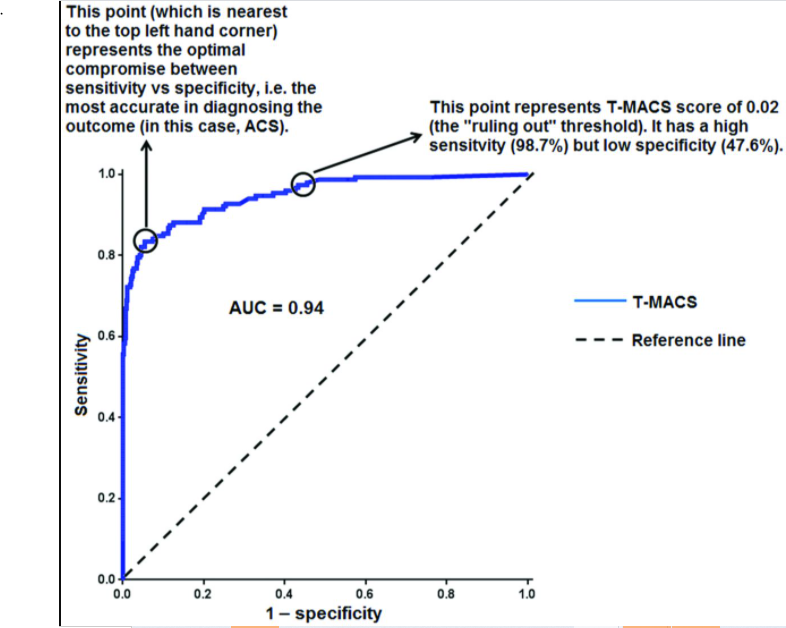
The area under the ROC curve (AUC) is a global measure of the ability of a test to discriminate whether a specific condition is present or not present. An AUC of 0.5 represents a test with no
discriminating ability (ie, no better than chance), while an AUC of 1.0 represents a test with perfect discrimination. The (unpublished) ROC curve for ACS (figure 1) which was generated from the T-MACS scores calculated for the derivation set has an AUC of 0.94 after correction for in-sample optimism by cross-validation, which would suggest that T-MACS score is a very good discriminator of ACS versus no ACS.When selecting an optimal threshold (or cut-off point), we need to consider the aims of the diagnostic test, considering the significance and costs of a false-positive or false-negative interpretation.
A commonly used approach when selecting a cut-off point is to give equal weight to the importance of sensitivity and specificity by choosing the point nearest to the top-left most corner of
the ROC curve.3 This point is also known as the
Youden Index.4 We illustrate how this is done using figure 1.
Repeating figure 1 below:
If the interest was to simply find the optimal trade-off between sensitivity and specificity, then a T-MACS score of ≥0.34 represents this point of balance. We can read from the ROC curve that sensitivity is 83.4% and specificity is 94.6% at this threshold.
If we use this threshold, then the T-MACS score has an accuracy of 92.2% in detecting ACS among adults presenting to ED with chest pain in the study.
Accuracy is defined as the proportion of correct decisions (ie, true positive+true negative) over the number of total tested.5
The AUC can be thought of an indicator of overall ‘accuracy’, and there is only one AUC value for each ROC curve. On the other hand, ‘accuracy’ will vary from point-to-point along the ROC curve, as there is variation in sensitivity and specificity
from point-to-point (see table 1).By selecting the threshold based on the trade-off between
sensitivity and specificity, we are assuming that the balance
between false-positive and false-negative rates is not clinically
important.6This may not be true in two common scenarios.
The first scenario is when the clinical risk of missing a particular diagnosis is disproportionate to the risk of overdiagnosis (or vice versa).
The second scenario is when the primary intended use of a diagnostic test is for either ‘ruling-in’ or ‘ruling-out’ a
target condition.In these scenarios, it is important to understand the balance between the two types of errors and to select the threshold accordingly.
[On page 358 of the article there is an excellent discussion of the concepts using the data of the Body article*.]
*Body R, Carlton E, Sperrin M, et al. Troponin-only manchester acute coronary syndromes (T-MACS) decision aid: single biomarker re-derivation and external validation in three cohorts. Emerg Med J Published Online First: 26 August
2016. doi: 10.1136/emermed-2016-205983.Body et al also selected a higher threshold of 0.95 for ‘ruling
in’ ACS. This threshold also has a modest accuracy of 88.6%,
due to the low sensitivity of 47.0%. However, this threshold
has a specificity of 100%, which means there is no false-positive result. Therefore, we can be confident that a patient at this
higher threshold is at a very high risk for ACS. In contrast, a
T-MACS score of ≥0.34 will result in a false-positive rate of
5.4% despite its superior accuracy of 92.2%.Table 1 represents the sensitivity and specificity of the various
T-MACS thresholds for ACS using the derivation set, linking
to the results tabulated in table 4 of the paper by Body et al.

Table 1 illustrates the rising specificity and declining sensitivity
with higher threshold values.A strength of the study by Body et al is the re-evaluation of the selected thresholds using a validation set. This yielded very similar results to the derivation set (eg, the sensitivity for the ‘ruled out’ threshold for ACS remains very high at 98.1%), suggesting that the thresholds selected are indeed robust.
Take home points
The ROC curve can be used to determine an appropriate cut-off,
affecting the sensitivity and specificity of the test. The selection
of a test threshold depends on the purpose of the test and not
necessarily just by giving equal weight to sensitivity and specificity to achieve higher accuracy.


