
Dr. Turner has produced two outstanding videos on the use of bedside ultrasound in the diagnosis of lung disease. In this post we’ll watch Intro to Pulmonary Ultrasound and review some of the highlights in notes and pictures after the video. In the next post we’ll watch Dr. Turner’s Advanced Pulmonary Ultrasound.
Introduction to Pulmonary Ultrasound
All that follows is from Dr. Turner’s YouTube video:
0:10: Diff Diagnosis: A 56 year old man with a 60 year history or smoking and a known left ventricular ejection fraction of only 35% presents with shortness of breath. Is it CHF or an exacerbation of COPD?
1:04: Evidence shows that chest ultrasound is superior to chest x-ray for differentiation of CHF from COPD and is also superior to physical exam.
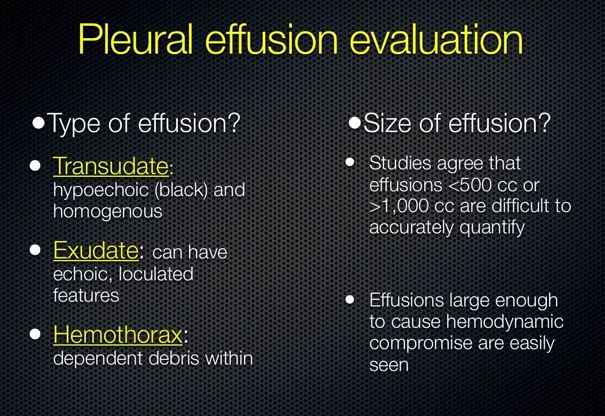
1:16: Evidence supports the use of chest ultrasound in diagnosing alveolar-interstitial syndromes, pneumothorax, pneumonia, chronic obstructive pulmonary disease, pleural effusion, hemothorax, and peripheral abscesses and tumors. And chest ultrasound is useful in the following procedures: chest tube and pigtail placement, thoracentesis, biopsy, abscess drainage, and recruitment maneuvers (1).
8 Key Probe Positions for Chest Ultrasound Scanning–4 on each side of the chest.
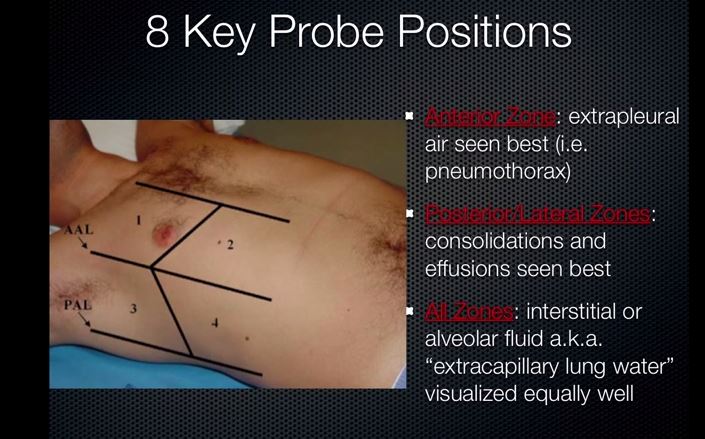
The linear probe is the one we want to use for lung ultrasound examination.
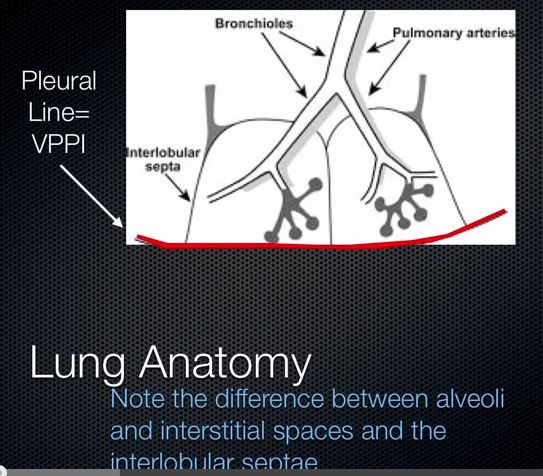
4:00: The Lung Anatomy

4:45:
5:05:
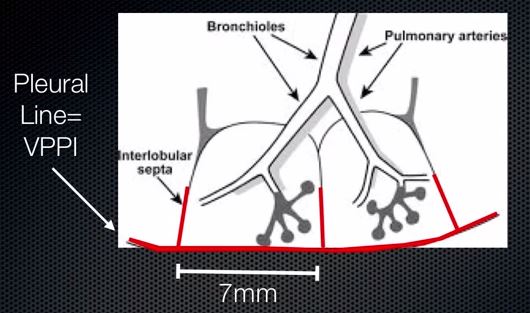
This 7 mm is an important number to remember.
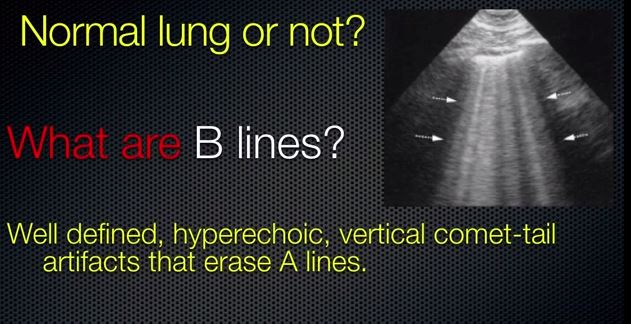
5:15: So we ask–Is the lung parenchyma normal or not?
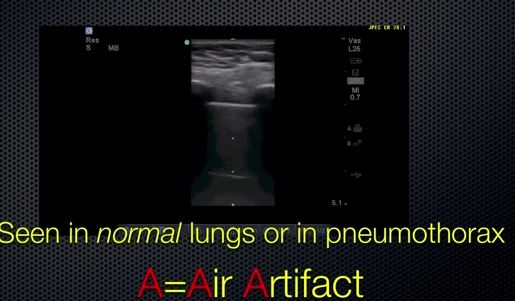
Are A lines present?
Are B lines present?
6:25: The A line is not an actual structure rather it is an artifact, a deep reflection of the pleural line.
6:30: And the A line(s) are spaced in multiples of the distance from the chest wall to the visceral-parietal pleural line (VPPI).
7:45: So what if there aren’t any A lines? Normal lung or not?–Not normal lung. Something has changed in the lung replacing air [normally present in the lung and responsible for the creation of the A line artifacts] with something other than air that can transmits sound waves: blood, interstitial or alveolar edema, infection, contusion, or tumor.
8:05: Normal Lung or Not Normal Lung?
B-lines tend to obliterate the A-lines.
8:15
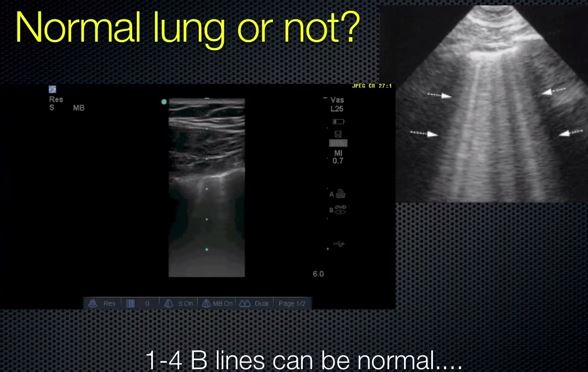
If you see small pleural lines which we call minor B line, that is just a representation that the visceral-parietal pleural interface is up to the chest wall and that the interlobular septa can be seen about 7 mm apart. And there again is that 7 mm number that we mentioned above.
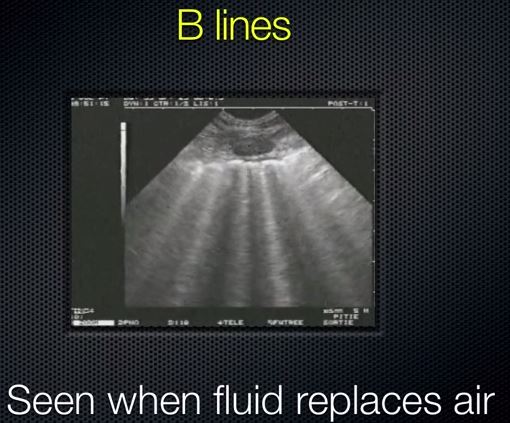
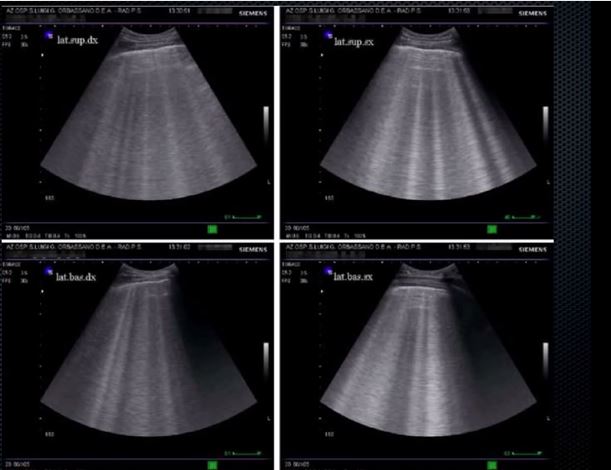
8:40: But if you have multiple B-lines that go all the way to the edge of the screen and that obliterate the A-lines, that is not normal. More than 5 in an area is very much abnormal and correlates with extra-vascular lung water or pulmonary edema.
8:55: It looks like a light show. You can see the movement with the pleural line moving. And you can see that they extend all the way to the edge of the screen.
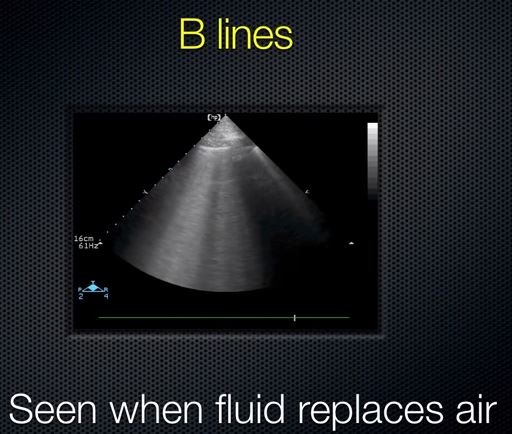
9:10: These B-lines are more confluent [wider] and that probably represents that fluid is not just in the interlobular septa but also in the alveoli themselves which tend to be 3 mm apart.
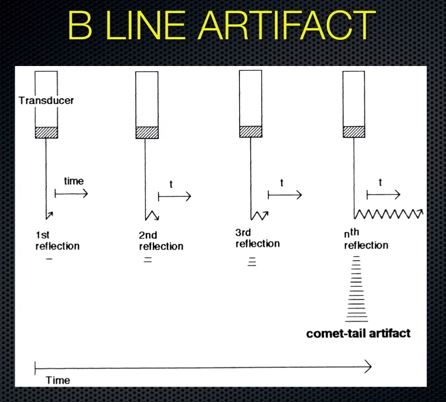
9: 20: B-line Artifact: Sound waves are trapped in the fluid filled interstitium or alveoli and reverberate within the interface infinitely. These reverberations create multiple vertical, bright white echoes that extend to the edge of the screen.
9:40: How the B-Line artifact is generated:
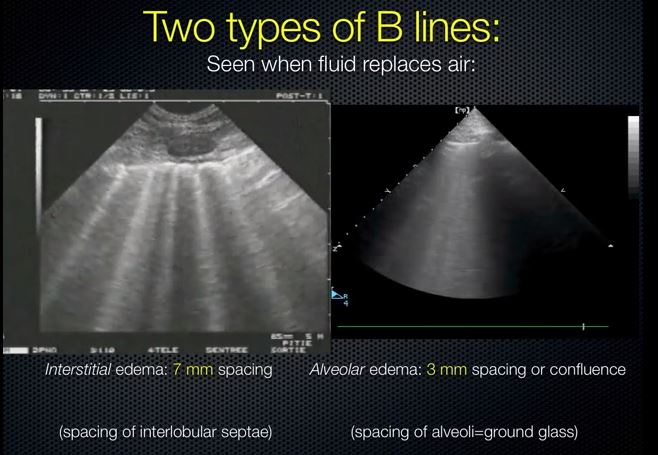
10:00: The two types of B-lines seen when fluid replaces air. Interstitial edema has 7 mm spacing which is the spacing of the interlobular septae (left picture) and alveolar edema has 3mm spacing or confluunce which is the spacing of the alveoli = ground glass (right picture):
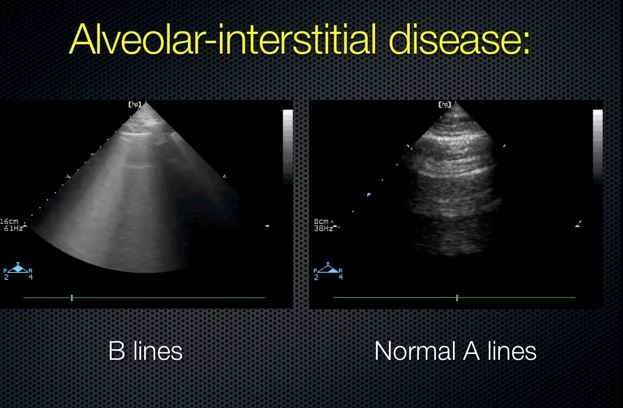
10:25: Alveolar-Interstitial Disease Key Findings:

-
Comet tails or B-lines anterior or lateral
- 7 mm apart: due to thickened interlobular septae in interstitial edema
- 3 mm apart: corresponds to alveolar edema
- Always multiple (If single or few, can be a normal finding in dependent zones.)
-
Paucity of A-lines–The B lines, which are pathologic, obliterate the A lines.
11:10:
11:17: More pictures of B lines:
11:23: “Kerley B lines” on a chest x-ray are due to edema in the interlobular septae. The interlobular septae come up perpendicular to chest wall just as we showed earlier in the diagram. And the ultrasound beam reflects back and forth within this [interlobular septal] interface and bounces off the air on either side and creates the artifact all the way down to the edge of the ultrasound screen.
12:00: Ultrasound for Pneumothorax
12:34: The sensitivity of a supine CXR [necessary in trauma patient] is only 47-75%.
13:00: Thoracic sonography for pneumothorax–A prospective evaluation of 176 blunt trauma patients with CT or “rush of air” used as the gold standard showed:
- CXR sensitivity 75%, specificity 100%
- EUS sensitivity 98%, specificity 99%
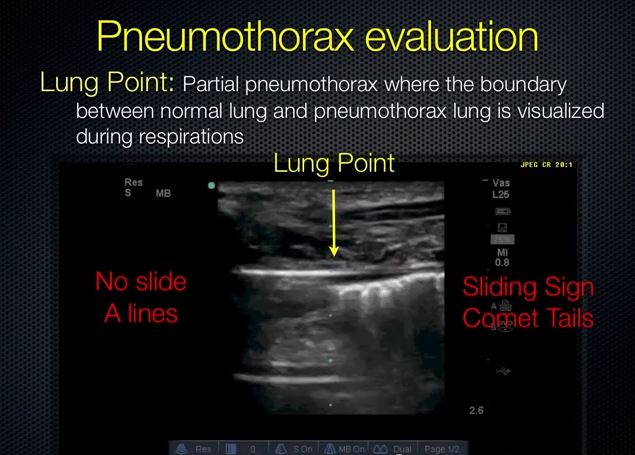
- Using multiple windows, we are able to assess the size of the pneumothorax with good correlation. You can do this by mapping out “lung point” which is the point where the lung drops away from the chest wall. And doing this you can get a good idea of what size the pneumothorax is.
13:54: Pneumothorax Scanning Technique
- You use a linear high frequency probe because you need high detail to see the pleural line.
- You orient the probe cephalad-caudad with the indicator towards the head.
- Place it in the 2nd intercostal space in the mid-clavicular line in (again) a vertical orientation.
- You want to watch four to five respiratory cycles.
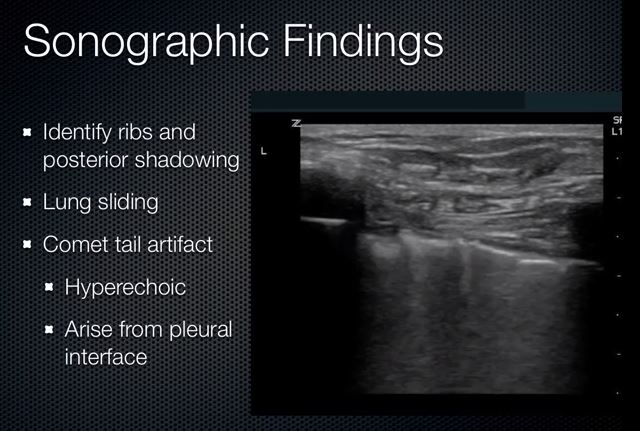
14:20: Three Key Diagnostic Techniques
- Identify the pleural line
- Observe lung sliding
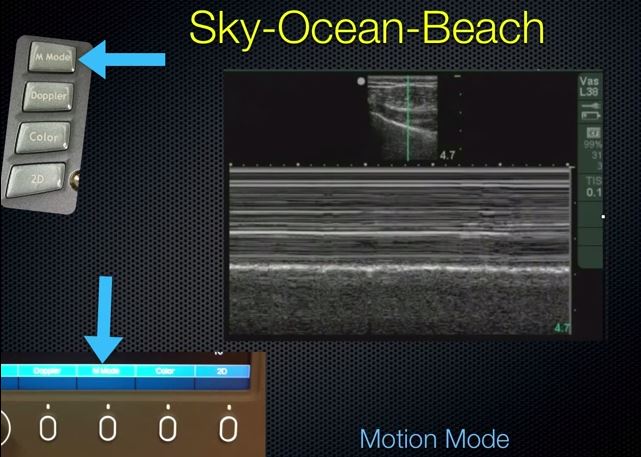
- Sky-Ocean-Beach interface on M-mode
15:00:
16:50: Note that you see the lung sliding and the (normal) minor B-lines moving back and forth. The picture below is normal (that is, when there is no pneumothorax).
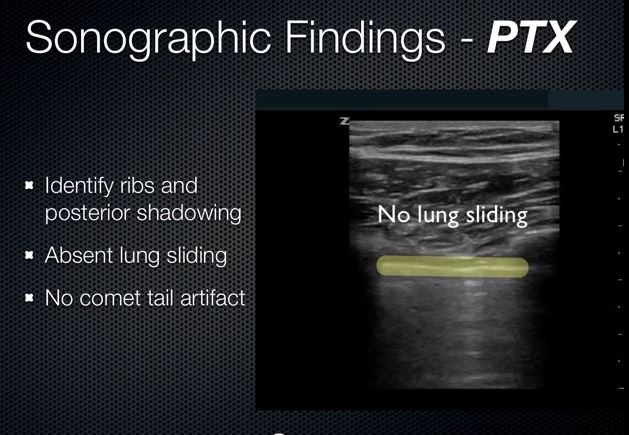
17:05: In pneumothorax below, there is no lung sliding at the pleural line (the bright white reflection that indicates the visceral-parietal pleural interface). The green bar in the illustration below labels the pleural line. And we also have lost the (normal) minor B-lines (no comet tail artifacts) that are usually there.
17:40: Below. Using M-mode.
18:10 Below.
19:10: Below. The bright white line is the pleural line.
19:37 to 20:54: Great example videos of diagnosis of pneumothorax using m-mode.
21:00: Below.
21:50: Below.
Image.
22:20: Pneumothorax Evaluation: Caution–Sliding sign can be absent in conditions other than pneumothorax:
- Effusions
- Consolidation with pleural adhesions
- Chest tubes
- Advanced COPD
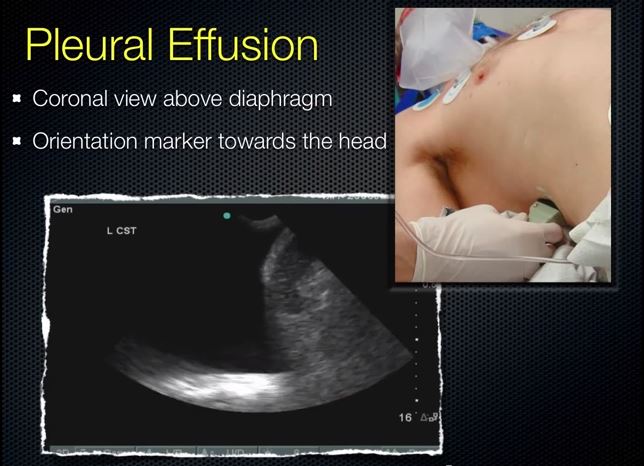
23:20 Below. You want to use the phased array low frequency probe so you can see deep. You place the probe at the mid-axillary line with the indicator towards the head.
23:49: Below. Black represents fluid because fluid is anechoic.
25:09: Below. You never know where the diaphragm will be (in COPD pts it will be low and in atelectatic pts it is high) so you just move the probe up and down in the mid-axillary line until you find the diaphragm.
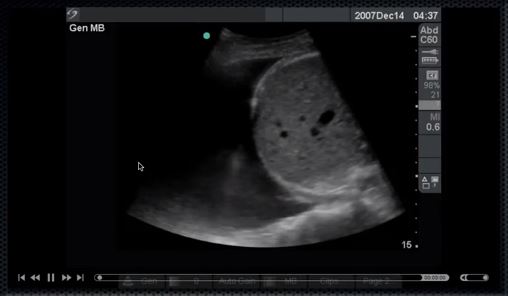
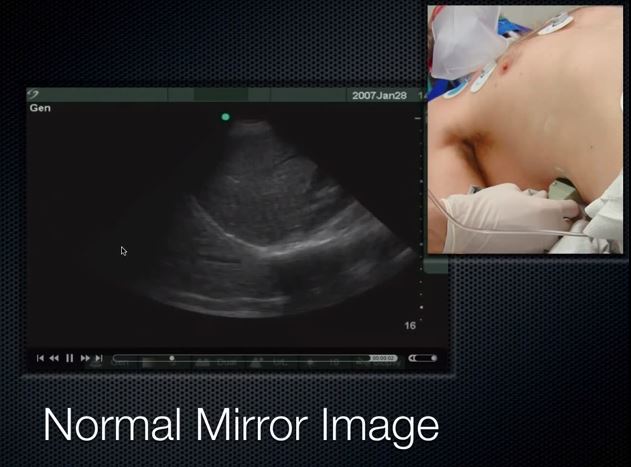
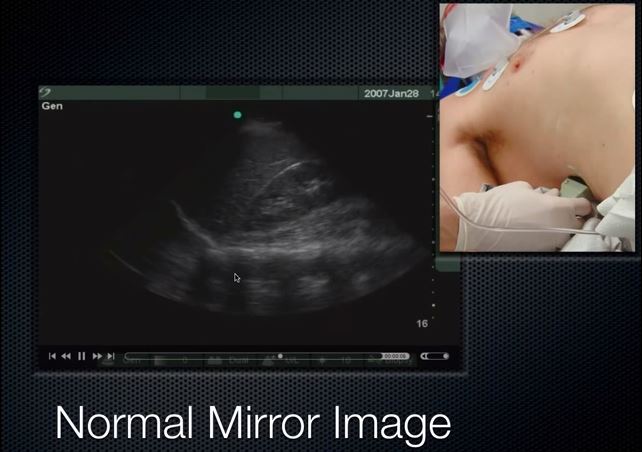
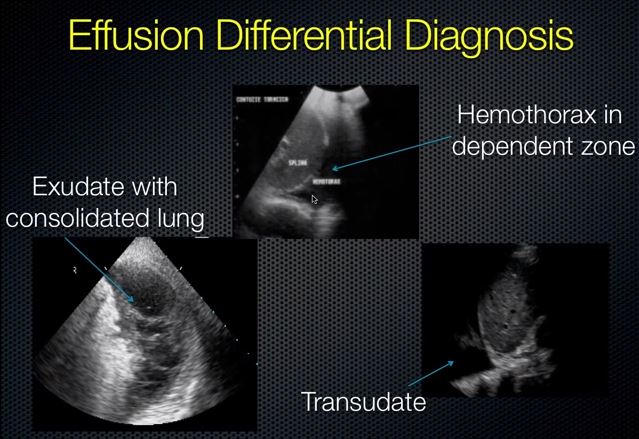
25:27 Below. How do we know when we don’t have free fluid above the diaphragm? Well, we count on the presence of mirror image artifact. Note that in the image below, we see what appears to be liver above the diaphragm. This is mirror image artifact. Because there is air and not free fluid above the diaphragm, the diaphragm-lung air interface gives a false picture of liver above the diaphragm.
26:20: But how do we know that this (above) is not hepatization of the lung (meaning very consolidated lung)? There are a couple of things we can look at and one is the spine sign shown below. So the vertebral shadows are able to be seen all the way up to the diaphragm. If there is air above diaphragm, you won’t be able to see the vertebrae above the diaphgragm and if there is fluid above the diaphragm you will see the vertebrae (see picture below 28:35).
27:41: Below.
28:35 Below. Note that in the transudate picture, you can see the spine beyond (above meaning cephalad) the diaphragm because the fluid in the chest cavity is transmitting the sound waves.
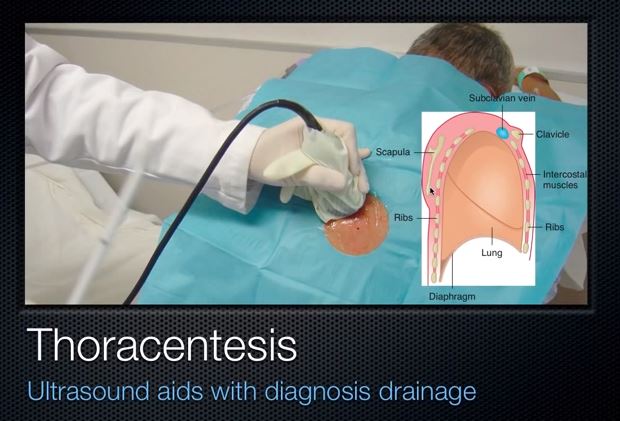
29:02 to 30:34: Below. Thoracentesis Using Ultrasound
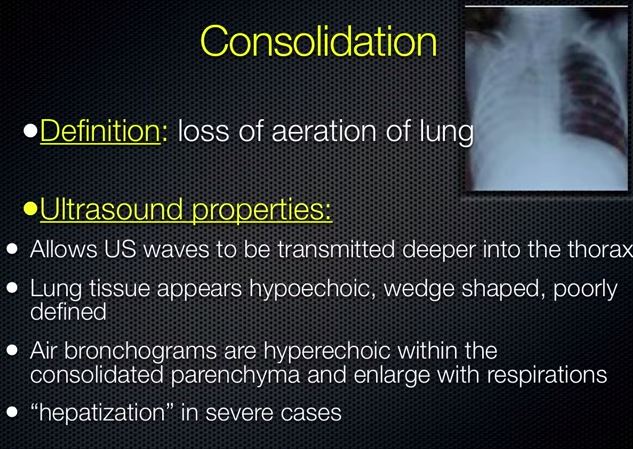
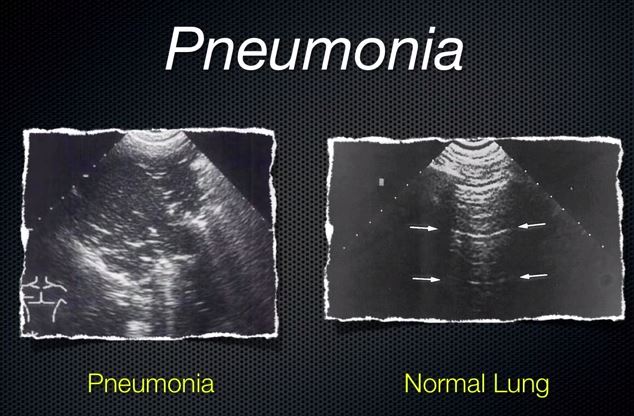
30:35: Using Ultrasound to Diagnose Pneumonia
30:57: Below.


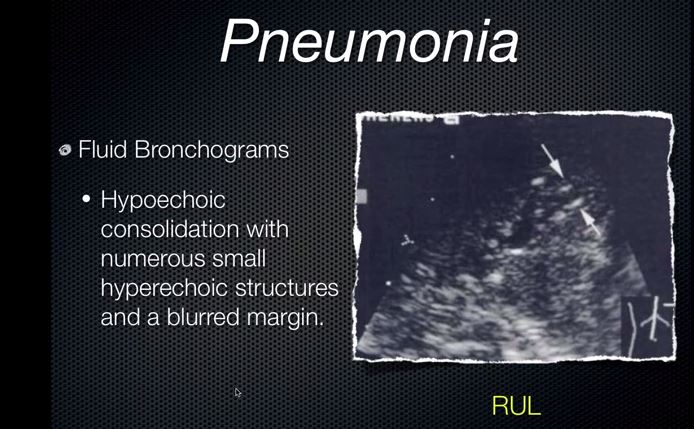
32:10: Below.
32:37: Below. Another example of consolidation.
32:47: Below.
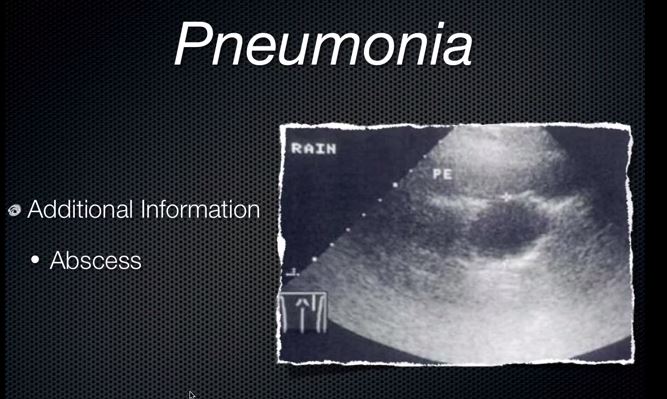
33:04: Below.
33:25: Below. Ultrasound has also been used to identify pulmonary abscess.
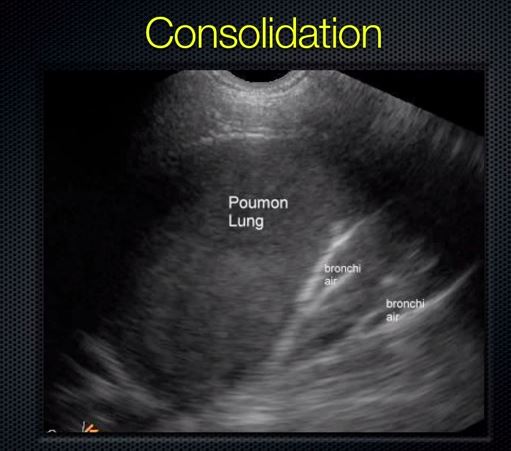
33:45: Below. French colleague shows a picture of consolidation with air bronchograms.
33:50 to 36:20: Below. Great Summary of the whole movie.
Additional Resources:


(1) For an explanation of what recruitment maneuvers are and when they are indicated see Efficacy and safety of recruitment maneuvers in acute respiratory distress syndrome. Ann Intensive Care. 2011; 1: 9. Published online Apr 19, 2011. doi: 10.1186/2110-5820-19.


