
This post contains excerpts from Resource (1) below, Ketogenic Ratio Determines Metabolic Effects of Macronutrients and Prevents Interpretive Bias:
INTRODUCTION
Thomas Seyfried remarked in his book [(1), page 6]: “The definition of ketogenic diet allows for considerable leeway in food choices as long as the individual has reduced blood glucose and is producing ketones.” Unfortunately, these parameters are lacking in many if not most of studies into metabolic effects of macronutrients. Meanwhile, there is a precise way to predict whether or not a diet will induce ketosis and the aim of this opinion article is to advocate a broader usage of this way. Why is this so important?
Excess of carbohydrate intake typical for consumers of the Western diet may cause detrimental effects on metabolism and increase risks of the onset and progression of many neurodegenerative diseases (2–4). On the other hand, diets high in fat and low in carbohydrates decrease appetite, probabilities of food addiction and obesity, and are neuroprotective (5, 6). Carbohydrate restriction induces physiological changes which are very similar to the well documented beneficial effects of calorie restriction (7, 8). Conversely, the hallmark of high carbohydrate diets is homeostatic inadequacy (9), an overproduction of reactive oxygen species and advanced glycation products, both of which are implicated in neuroinflammation and neurodegeneration (10–12). However,
the meaning of “high” or “low” in diets’ definition has been drifting away from the previously established quantitative criterion known as ketogenic ratio.THE KETOGENIC RATIO
Almost a century ago, Woodyatt (13) wrote: “antiketogenesis is an effect due to certain products which occur in the oxidation of glucose, an interaction between these products on the one hand
and one or more of the acetone bodies on the other.” The ketogenic ratio (KR), as proposed by Shaffer (14), is a ratio of the sum of ketogenic factors to the sum of antiketogenic factors: KR = K/AK. The antiketogenic part of the equation invariably equals 1 so the KRs are always expressed as 2:1, 4:1, etc. For the sake of economy of reading, we leaved out the repeating part not bearing any information and mention only the informative digit.Shaffer concluded that the maximal ratio compatible with the oxidation of the “ketogenic” molecules becomes possible at the KR = 1, making KRs below 1 antiketogenic and KRs above 2 ketogenic. Wilder and Winter (15) described the KR of a food in terms of times the fat content exceeds the amount of carbohydrate and protein combined, roughly. The reasoning was based on their own experimental observation that fats are predominantly ketogenic (90%), carbohydrates are almost 100% anti-ketogenic, and protein is both ketogenic and
antiketogenic, 46–58% respectively. They arrived, along with
Woodyatt and Sansum (13), at the conclusion that KR for
induction of ketogenesis should be 2 or higher while the upper
limit of antiketogenesis is 1.In 1980, Withrow (16) modified the equation and since that
time, the equation looked like this:KR = (0.9 F + 0.46 P): (C + 0.58 P + 0.1 F) where F
is grams of fat; P is grams of protein and C is grams of
carbohydrate. Currently, this equation is rarely used in nutrition research and less so in dietetic practice, which is regrettable since properly calculated KRs reveals interesting patterns of diet effects. Previously (9), using the Withrow’s equation, we calculated KRs in a number of diets and came to conclusion that the watershed in the group of effects occurs at KR of about 1.7. Above this value, metabolic features of diets were characteristic for ketogenesis, while below this value, they were characteristic for the obesogenic high-fat diet (oHFD), which, in contrast to the diet resulting in ketosis (KD), is high in fat but also in carbohydrates. Here, we analyzed three groups of diets in order to compare our observation regarding the watershed with the classification of diets made by the authors of 62 studies, in which it was possible to calculate KRs.UNCERTAINTY IN CURRENT DIET
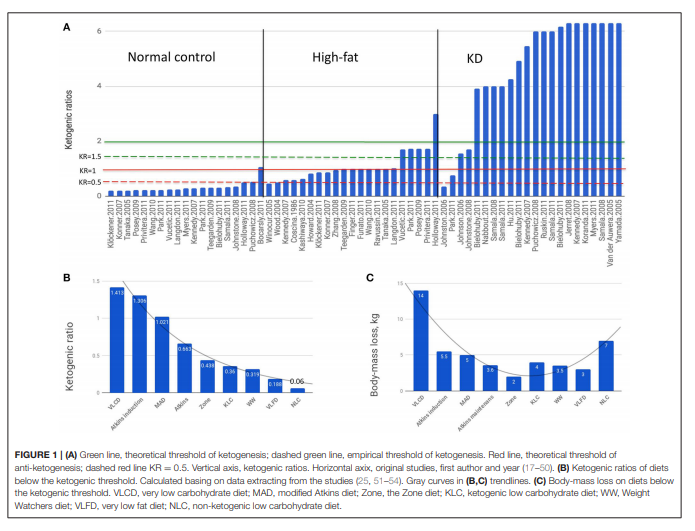
LABELLINGWe can see that there is no common criteria in choosing
diet compositions for the “normal control” group to start
with (Figure 1A). The vast majority of “normal control” diets
are clearly anti-ketogenic (KRs below or equal 1). The oHFD
group of diets had broader spectrum of KRs ranging from the
anti-ketogenic 0.456 to clearly ketogenic 2.994. The KRs of
diets, which were considered ketogenic by the authors, ranged
especially broadly: from 0.36 to above 6. The macronutrient
compositions of oHFD diets and KDs overlap although the
obesogenic oHFD is discussed in literature as diametrically
different from the KD. The metabo- and neuroprotective effects
of KD are experimentally and clinically confirmed, however, the
low compliance rate of the strict KD caused mass attempts to
reduce the KR below KR = 2, which for a century used to be the
minimal accepted value to consider a diet ketogenic.
EFFECTS OF KD VS. OHFD
Basing on our review of KR-dependent effects of diets (6), here
we compiled a brief overview in order to demonstrate the critical differences between KD and oHFD.1. The risks of pathologies caused by brain hypometabolism (e.g., due to hypoxia, hypoglycemia, brain trauma) is reduced in
diets capable of inducing ketogenesis; the opposite is shown
for the oHFD diets (39, 61–69).
2. Inflammation, e.g., neuroinflammation is shown to be induced by oHFD but decreased by KD (70–78) among other things resulting in improved or impaired cognitive function (76, 78–82).
3. Neuronal hyperactivity and epilepsy is attenuated by KD but
exacerbated by oHFD (75, 83–85, 85–88).
4. Inhibition of growth of tumor and metastasis as well as
tumor neo-angiogenesis is demonstrated for KD while oHFD
increases the risk of cancerogenesis (8, 89–92).
5. KD decreased cardiovascular risks while oHFD increases them (93, 94).
6. KD lowered the type 2 diabetes risks, improves management
of complications and glucose control while oHFD increases
the risks, exacerbates complications and induced glucose
intolerance (95–99).BELOW THE KETOGENIC THRESHOLD
In the ragne of KRs between 1 and 2 lays the area of metabolic uncertainty where the effects are poorly predictable, the definitions are vague and outcomes even more so. The most
critical value in this area is 1.5, the experimentally reached
threshold of anti-ketogenesis (100). Here we report the result
of our analysis of non-ketogenic diets (Figures 1B,C) using data
extracted from the studies:
- Very low carbohydrate diet [VLCD, (51)];
- The Atkins diet – induction and maintaining phases, the Zone diet and very low fat diet, [VLFD, (52, 53)];
- MAD, Zone, Weight Watchers diet (WW) and VLFD (54);
- Ketogenic low carbohydrate diet (KLC) and non-ketogenic low carbohydrate diet (NLC) (25).
The common feature of these diets was that none of them reached the threshold of ketogenesis defined as KR = 1.5 (100). The diets were roughly isocaloric (1,412 ± 35.5 Kcal/day; caloric intake of WW varied averaging 1,400 Kcal), with main outcome a body mass loss. Beyond the strictly utilitarian standpoint, body-mass loss is an indicator of lipolysis and thus of ketogenesis likelihood.
In diets ranging from KR = 1.413 to KR = 0.06 (Figure 1B), the metabolic outcome did not depend on KR as directly as it does above the ketogenic threshold (Figure 1C) indicating that mechanisms other than the ketogenesis-glycolysis counterbalancing seem to be predominant. Indeed, in the study
of Johnston et al. (25) the inverse relationship has been observed: the KLC diet having six times higher KR than NLC (0.35 vs. 0.06) had almost twice lower effect (4 vs. 7 kg) leading the authors to conclusion they even used as the article title: “Ketogenic low carbohydrate diets have no metabolic advantage over nonketogenic low-carbohydrate diets”—although both diets were undoubtedly anti-ketogenic.
Resources:
(1) Ketogenic Ratio Determines Metabolic Effects of Macronutrients and Prevents Interpretive Bias [PubMed Abstract] [Full Text HTML] [Full Text PDF]. Front Nutr. 2018 Aug 30;5:75. doi: 10.3389/fnut.2018.00075. eCollection 2018.
(2) Carbohydrate-Biased Control of Energy Metabolism: The Darker Side of the Selfish Brain [PubMed Abstract] [Full Text HTML] [Full Text PDF]. Front Neuroenergetics. 2011 Dec 20;3:8. doi: 10.3389/fnene.2011.00008. eCollection 2011.


