
Dr. Rola blogs at thinkingcriticalcare.com.
Here is the link to Dr. Rola’s outstanding video of October 9, 2020, Mayo Clinic Critical Care Grand Rounds: Venous Congestion and VExUS [POCUS Assessment Of Venous Congestion] on Vimeo.
Here are excerpts of key points:
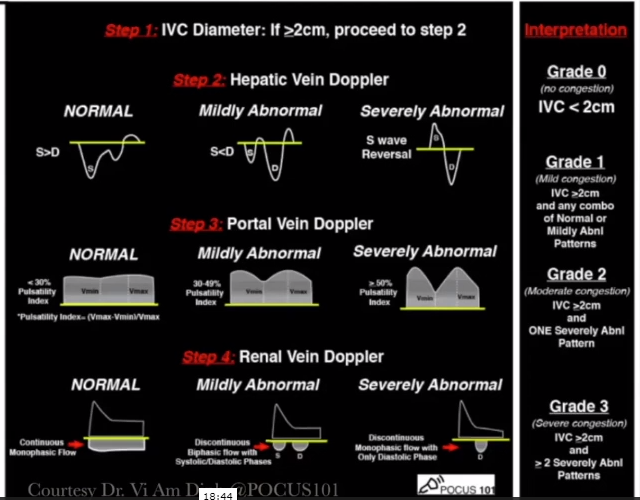
First assessment for venous congestion is the IVC:
We need to evaluate IVC size in both the long axis and the short axis.
Here is an IVC in long axis-it looks full (say 2 cm):
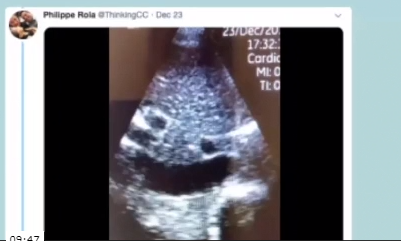
But if we examine the same IVC in transverse view, we see it is clearly not distended:

And in the IVC above all of the collapse was side to side. So if we looked only at the long axis view, we would be fooled.
We’re looking for in the IVC the volumetric variation due to pressure variation which requires assessing both longitudinal and transverse view with special attention to the view that shows the most respiratory variation.
We eyeball the variation just like we do the ejection fraction. And the results from eyeballing in both are more than satisfactory.
Second Assessment for venous congestion is the Hepatic Vein:
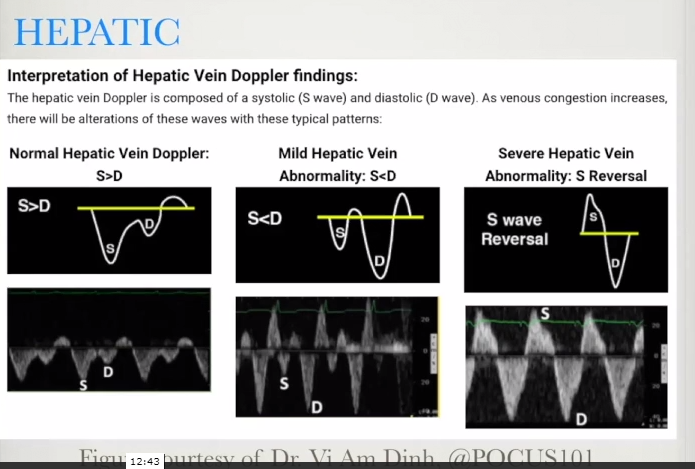
The above is showing the actual reflection of your CVP tracing. And these waves represent the actual venous flow into the right atrium.
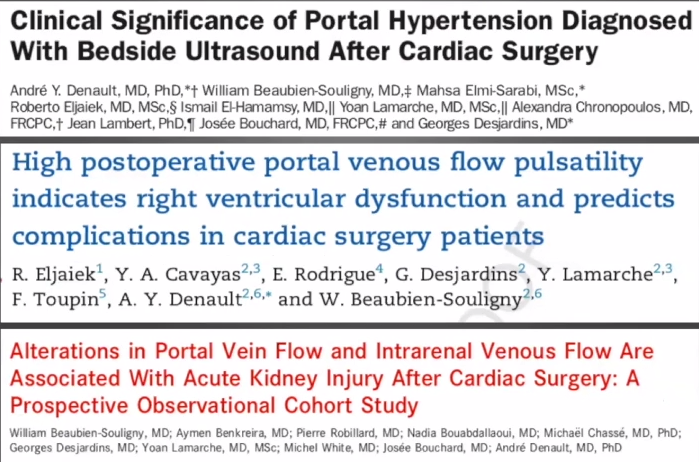
Third Assessment for venous congestion is the Portal Vein:
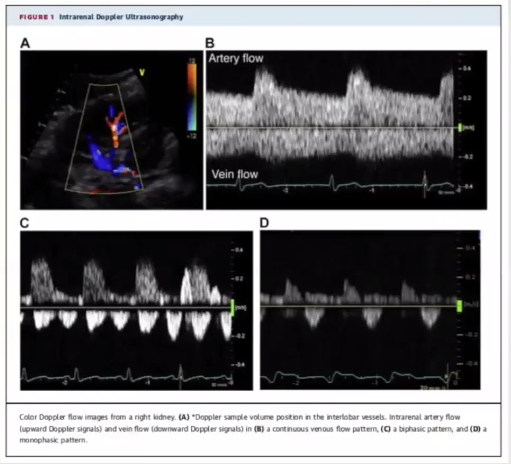
Fourth Assessment for venous congestion is renal blood flow:
Congestion causes renal venous flow to go from a continuous to a discontinuous pattern.
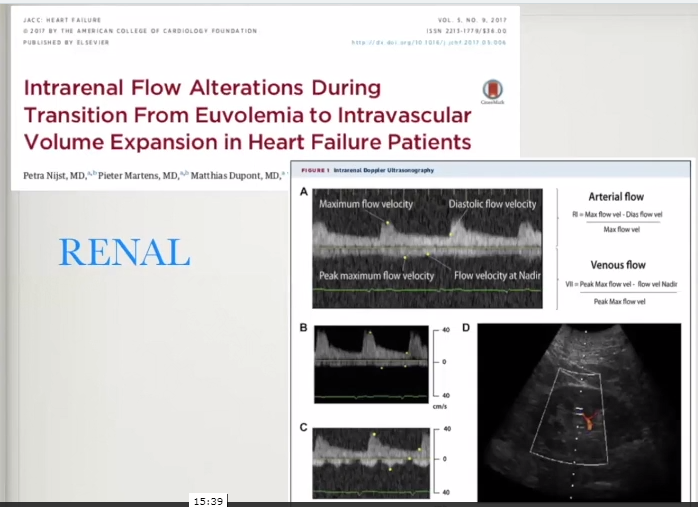
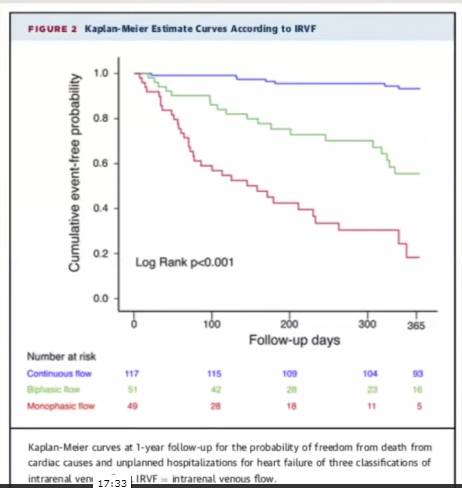
One of the best articles on the above topic is Clinical Implications of Intrarenal Hemodynamic Evaluation by Doppler Ultrasonography in Heart Failure [PubMed Abstract] [Full Text HTML] [Full Text PDF]. JACC Heart Fail. 2016 Aug;4(8):674-82:
Conclusions from the above article
IRVF [Intrarenal Venous Flow] patterns, rather than RI, depended on RAP, suggesting a correlation with renal congestion. In addition, IRVF patterns strongly correlated with clinical outcomes independent of RAP and other risk factors and might provide additional information to stratify vulnerable HF patients.
Resuming Dr. Rola’s narrative:
“The intrarenal venous flow pattern, the dysfunction, was much more related to congestion, meaning the right atrial pressure rather than the forward flow because a lot of the focus has been on the low output state and that being the real problem; when, in fact, it seems that the congestion state may actually be physiologically more important.”
16:30:
17:30:
18:04:

Quantifying systemic congestion with Point-Of-Care ultrasound: development of the venous excess ultrasound grading system [PubMed Abstract] [Full Text HTML] [Full Text PDF]. Ultrasound J. 2020 Dec; 12: 16.
Abstract
Background
Organ congestion is a mediator of adverse outcomes in critically ill patients. Point-Of-Care ultrasound (POCUS) is widely available and could enable clinicians to detect signs of venous congestion at the bedside. The aim of this study was to develop several grading system prototypes using POCUS and to determine their respective ability to predict acute kidney injury (AKI) after cardiac surgery. This is a post-hoc analysis of a single-center prospective study in 145 patients undergoing cardiac surgery for which repeated daily measurements of hepatic, portal, intra-renal vein Doppler and inferior vena cava (IVC) ultrasound were performed during the first 72 h after surgery. Five prototypes of venous excess ultrasound (VExUS) grading system combining multiple ultrasound markers were developed.
Results
We found that defining severe venous congestion as the presence of severe flow abnormalities in multiple Doppler patterns with a dilated IVC (≥ 2 cm) showed the strongest association with the development of subsequent AKI compared with other combinations (HR: 3.69 CI 1.65–8.24 p = 0.001).
[And], this severe VExUS grade offered a useful positive likelihood ratio (+LR: 6.37 CI 2.19–18.50) when detected at ICU admission, which outperformed central venous pressure measurements.
Conclusions
The combination of multiple POCUS markers may identify clinically significant venous congestion.
18:50:
If you have a plethoric IVC that is associated with increasing numbers of doppler abnormalities then you are getting a worse and worse level of congestion obviously and that correlated strongly with the development of acute kidney injury. In fact, even better than the portal vein alone which was possibly a bit of a surprise. [Dr. Rola explains why portal vein pressures alone are less reliable – see video for explanation.]
20:00 – 25:12: How to do the VExus Scan

25:17: How does this [the VExUS exam] help me take care of patients?
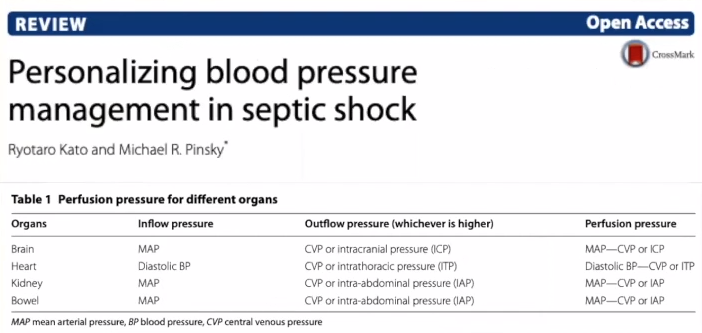
The concept of organ perfusion pressure will mostly talk about the MAP – CVP in textbooks. And using our numbers [figure below], what is our CVP range – maybe 0 -15, maybe 20? It is relatively easy to disregard the CVP as not that significant [given that the MAP is 95].
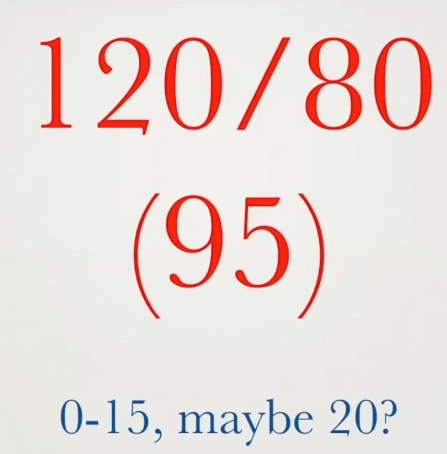
25:54: [But the chart below shows us why an elevated venous pressure can compromise perfusion.]
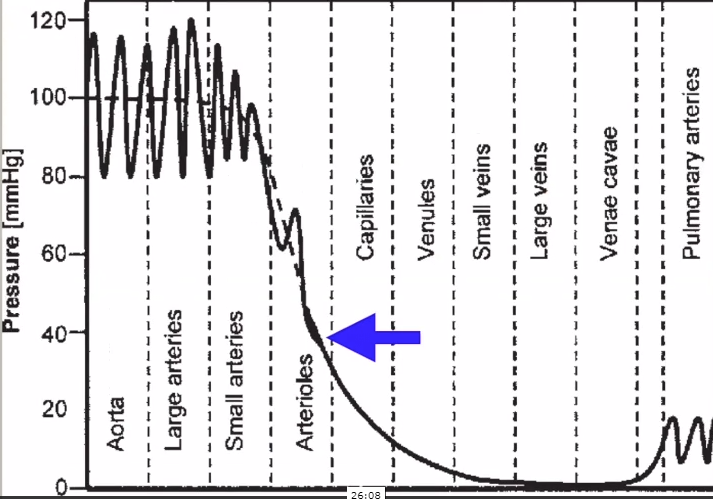
26:00: If we look at the actual pressures along the route [graph above], everyone knows that the level of the real resistors is at the small arteries and [especially] the arterioles – that is where you get the big pressure drop.
And in terms of any tissue, tissue bed perfusion pressure, the real question is what is the in pressure and the out pressure.
And look at [the chart above], your average precapillary arteriolar pressure is somewhere in the 40s.
And now, all of a sudden, that venous pressure, especially if it is getting up there in the 15s or 20s, might have a lot more impact than when it is being compared to a pressure of 95 [which is the mean arterial pressure in our example above].
When we think about it, we are measuring the pressure [systolic,diastolic, and MAP] before the resistor [the arterioles].
Although there is clearly a relationship, by the time we get to the real inflow pressure, it is a lot lower than we are accustomed to thinking about.
27:22
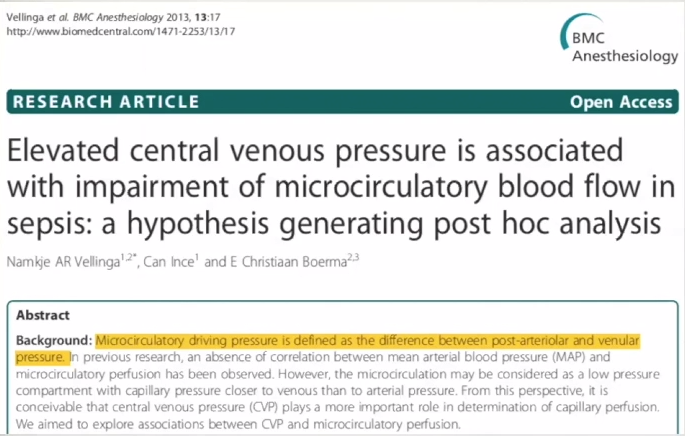
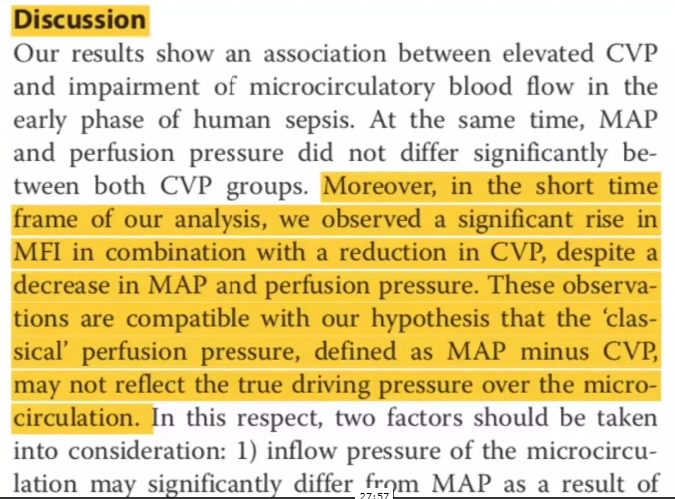
27:57 From the above article, Dr. Rola observes that in terms of tissue perfusion, a low CVP is equally as important as a decent blood pressure.
28:15: That CVP of 12 that we think about from an ICU perspective, and protocols and all that, is on that lower range. A lot of times we’re suggested to go for 12 or 15 of CVP.
28:27 And yes, I’m sure that there are people who are saying, “well, wait a minute. That is for ventilated patients.”
But just as some people say, “Well, some of the abormalities are just tricuspid regurgitation.
Well, the splanchnic tissues, the rest of the tissues; they’re not that bright. They don’t care so much that someone who is on a ventilator has tricuspid regurge. What they care is the pressure that is facing their perfusion.
28:50 [The figure below] just shows how that the vessel perfusion goes down with the elevation of central venous pressure
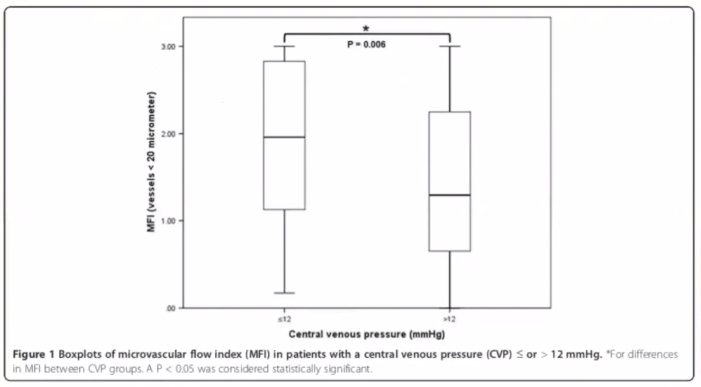
29:00 So the concepts of simply MAP minus CVP probably do need be re-examined a little more closely.
29:04 This nice full IVC where the volume responsiveness has nicely been eradicated, despite the intention of a fluid bolus might be a hinder rather than a help to tissue perfusion.
And a number of studies support this in terms of outcome also.
The Boyd paper in 2010 or 2011 showed how mortality was actually highest in the higher CVPs.

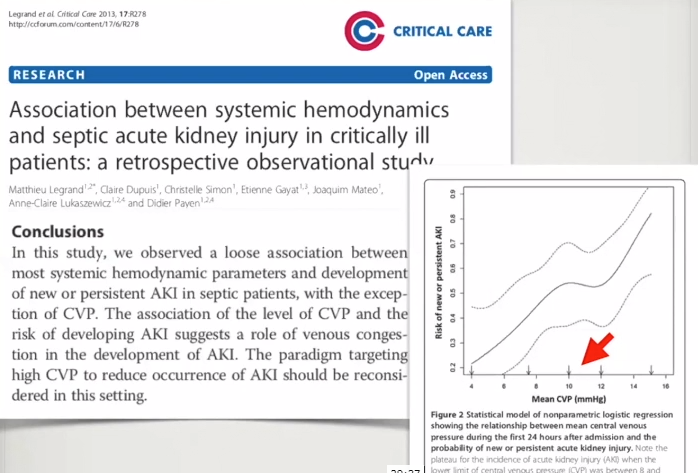
29:33 Well, what about the kidneys — start here.
At 40:30 to 44:44, Dr Rola shows us how to use a hand held POCUS machine’s color doppler to perform a “VExUS Lite” if you hand held does not have CW or PW. [And the newest Butterfly, the Butterfly IQ+ now has PW. I don’t know yet know if the instrument can make the more sophisticated doppler measurements Dr. Rolla shows us.]
Additional Resource
Quantifying systemic congestion with Point-Of-Care ultrasound: development of the venous excess ultrasound grading system [PubMed Abstract] [Full Text HTML] [Full Text PDF]. Ultrasound J. 2020 Dec; 12: 16.
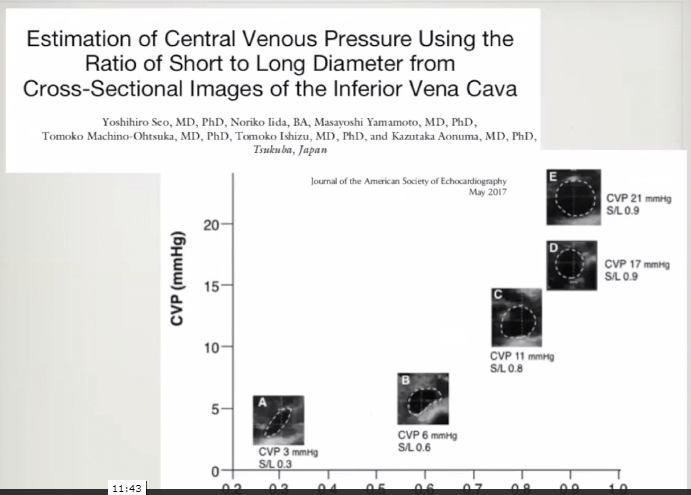
Three-Dimensional Inferior Vena Cava for Assessing Central Venous Pressure in Patients with Cardiogenic Shock [PubMed Abstract]. J Am Soc Echocardiogr. 2018 Sep;31(9):1034-1043.


