
So today, I tested myself on the ECGs of Emergency Medicine Cases’ ECG Cases 1: Missed Ischemia-Never Trust The ECG Computer Interpretation. Written by Jesse McLaren; Edited by Anton Helman. September 2019.
For case 4 I reviewed Life In The Fast Lane‘s excellent post on the the De Winter T- Wave.
Here are the take home points from ECG Cases 1: Missed Ischemia-Never Trust The ECG Computer Interpretation:
Take home points for Missed Ischemia Never Trust the ECT Computer Interpretation
Never trust the ECG computer interpretation, even if it says “normal,” because:
ischemic morphology: the computer focuses on ST segment elevation, and can miss ischemic ST-T wave morphology—including straight or convex ST segments, terminal T wave inversion, down-up T waves, hyperacute T waves, deWinter T waves, and inverted U waves
dynamic change: the computer interprets each ECG in isolation, and can’t compare to prior or repeat ECGs (which is critical in a dynamic process like coronary occlusion)—so it can miss subtle changes, including pseudonormalization of ST segments or T waves
STEMI criteria: computer interpretation is based on STEMI criteria, which has limited sensitivity for identifying acute coronary occlusion—so it can miss subtle ST elevation (which may be significant in small amplitude QRS complexes), ST depression in aVL (which is very sensitive for inferior MI), and subtle signs of LAD occlusion like terminal QRS distortion.
This blog will explore all these signs in more detail, and more.Never trust the ECG computer interpretation, even if it says “normal,” because:
- ischemic morphology: the computer focuses on ST segment elevation, and can miss ischemic ST-T wave morphology—including straight or convex ST segments, terminal T wave inversion, down-up T waves, hyperacute T waves, deWinter T waves, and inverted U waves
- dynamic change: the computer interprets each ECG in isolation, and can’t compare to prior or repeat ECGs (which is critical in a dynamic process like coronary occlusion)—so it can miss subtle changes, including pseudonormalization of ST segments or T waves
- STEMI criteria: computer interpretation is based on STEMI criteria, which has limited sensitivity for identifying acute coronary occlusion—so it can miss subtle ST elevation (which may be significant in small amplitude QRS complexes), ST depression in aVL (which is very sensitive for inferior MI), and subtle signs of LAD occlusion like terminal QRS distortion.
This blog will explore all these signs in more detail, and more.
Before we start the quiz, we get the hint from Dr. McLaren:
In this ECG Cases – Missed Ischemia – Never Trust the ECG Computer Interpretation, we review ECGs from 7 patients presenting to the ED with chest pain, all of whom had a computer interpretation as “normal.” And guess what…they all show acute ischemia! Can you see what the computer couldn’t?
So I go through each ECG systematically using the HEART memory aid [H = rate and rythm, E = electrical conduction, A = Axis, R = R-wave, T = Tension (evidence of LVH, RVH, or chamber enlargement), and S = ST-T changes]
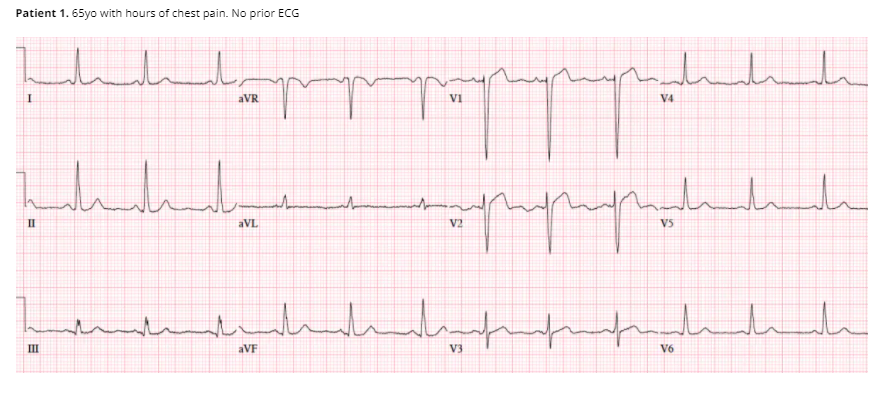
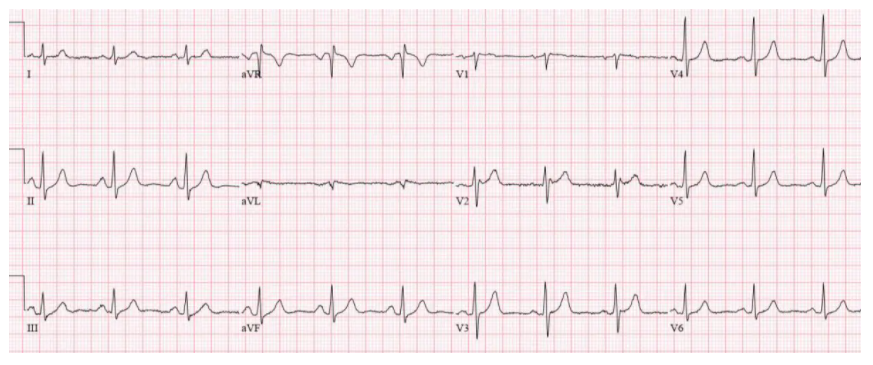
So here is my analysis of Case 1 ECG:
NSR/N electrical conduction/N axis/N R-wave progression/No hypertrophy/ST elevation in V1 and V2.
And Dr. McLaren’s analysis:
Patient 1. ischemic ST morphology
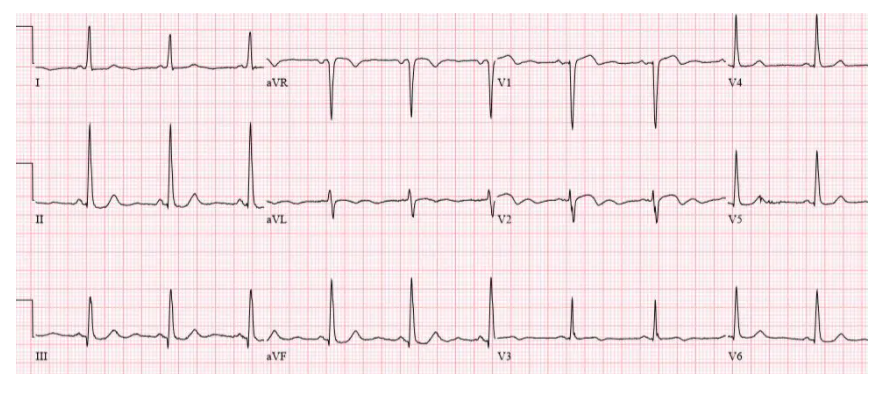
NSR, normal conduction/axis/R wave, no hypertrophy. Mild ST elevation in V1-2 which could be normal, but the morphology is not: ST is convex in V2 and straight in V3. Plus there’s an inverted U wave in V2, another marker of LAD occlusion. When trop returned positive an hour later, repeat ECG below showed further convex ST in V1-2 and terminal T wave inversion, and cath lab was activated: 100% mid LAD occlusion
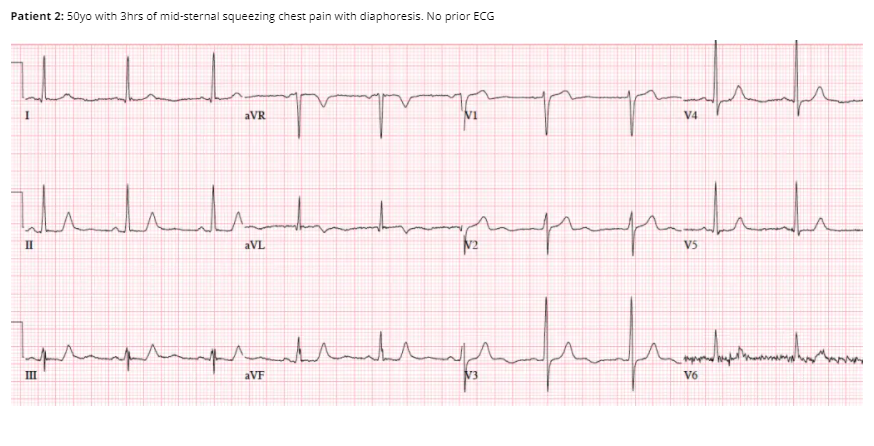
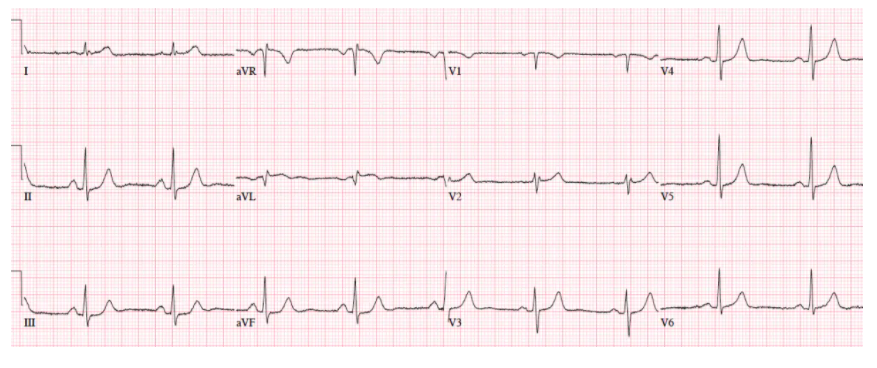
My analysis of ECG Case 2:
NSR/N electrical conduction/N axis/Early R-wave progression/No hypertrophy/No ST-T changes [at least I can’t see them], inverted U wave in V3
Dr. McLaren’s analysis of Case 2:
Patient 2: ischemic T wave morphology
NSR, normal conduction/axis/R wave, no hypertrophy. No ST segment elevation or depression, but there is terminal T-wave inversion in aVL and reciprocal down-up T waves in III/III/aVF, and inverted U wave in V2-3. The physician was concerned about these and asked for a repeat ECG:
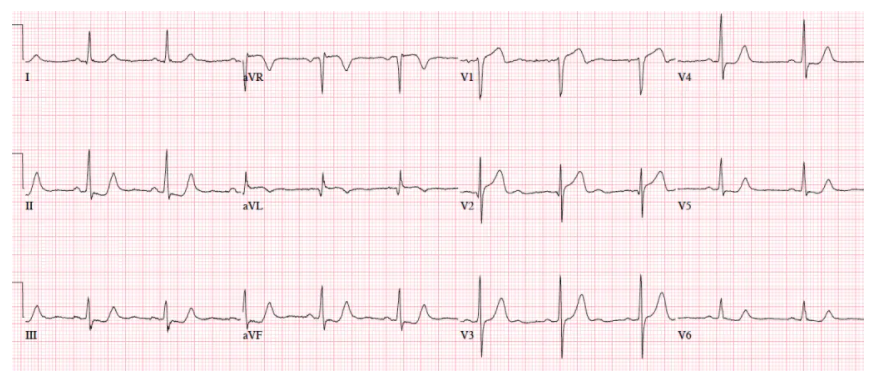
And Dr. McLaren observes:
Now there is ST elevation in V1-2 and aVL, a deeper Q wave in aVL and new Q wave in V2, and ST depression inferolaterally. Code STEMI called: 95% proximal LAD occlusion

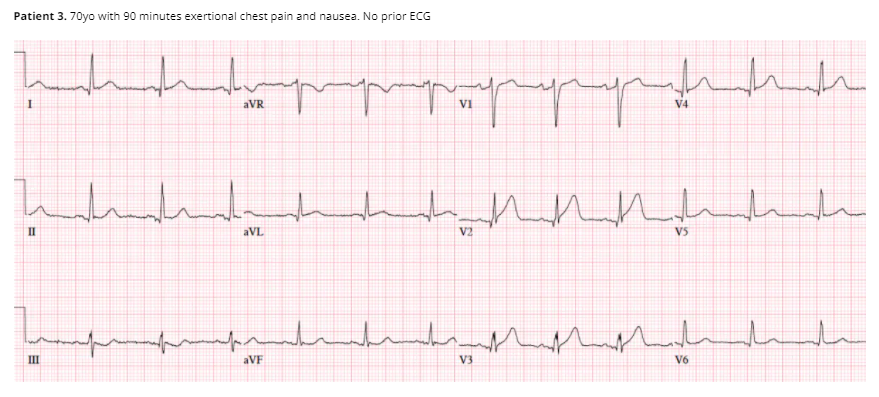
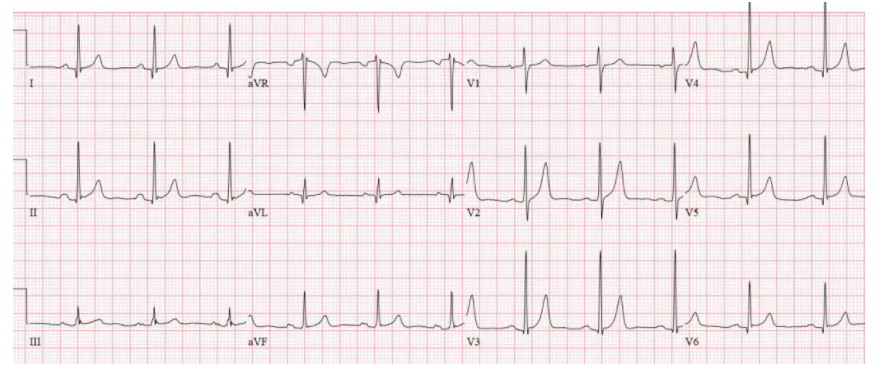
Patient 4: 70yo with one hour of exertional chest pain radiating to the arm. Old then new ECG
My analysis of ECG Case 4:
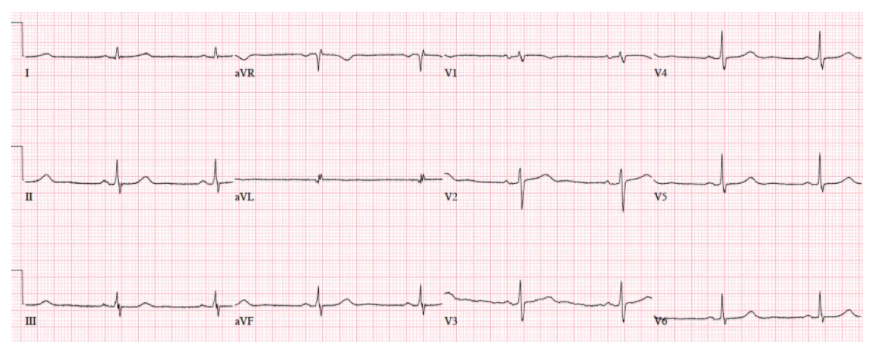
Old ECG: NSR/Normal Electrical Conduction/Right sided R-wave progression/Normal chambers/ST-T, Normal.
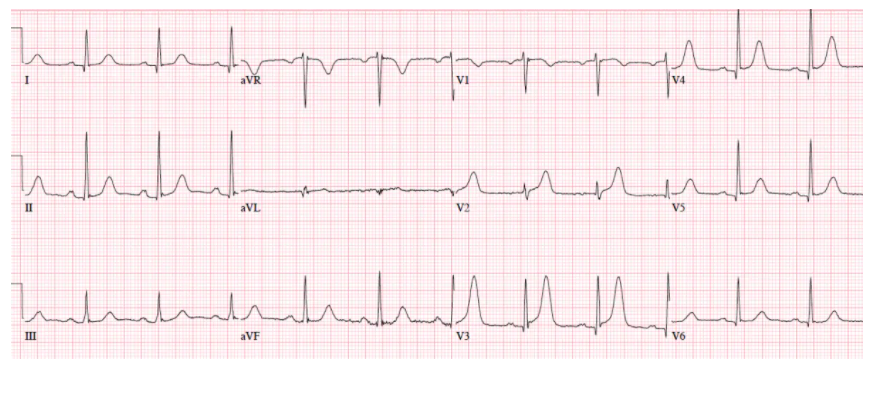
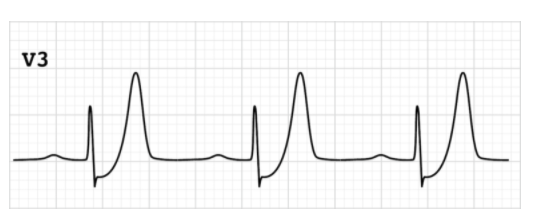
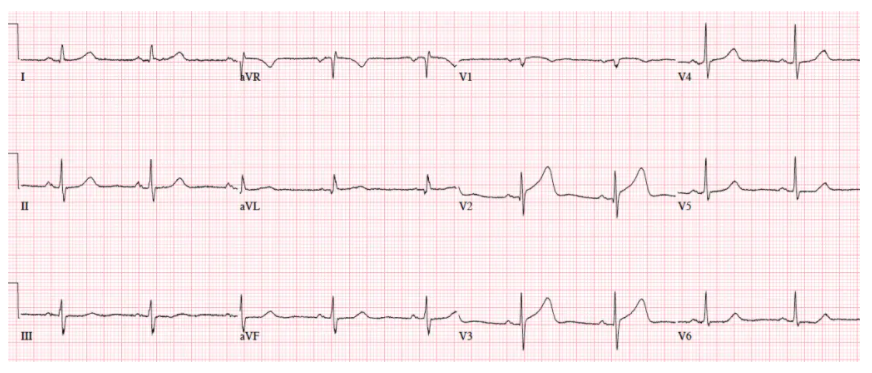
New ECG: NSR/Normal Electrical Conduction/Right sided R-wave progression/Normal chambers/ST-T, acute T waves in V2 and V3, ST elevation in V3 – V5.
Dr. McLaren’s interpretation of Case 4
Patient 4: subtle LAD occlusion
NSR, normal conduction/axis/R wave progression, no hypertrophy. Compared to the old ECG there is no ST elevation, but there are three other signs of occlusion: hyperacute T waves (now bigger than the R wave in V2 and as big as the R wave in V3), a deeper Q wave in V3, and terminal QRS distortion in V3. Physician asked for a repeat ECG
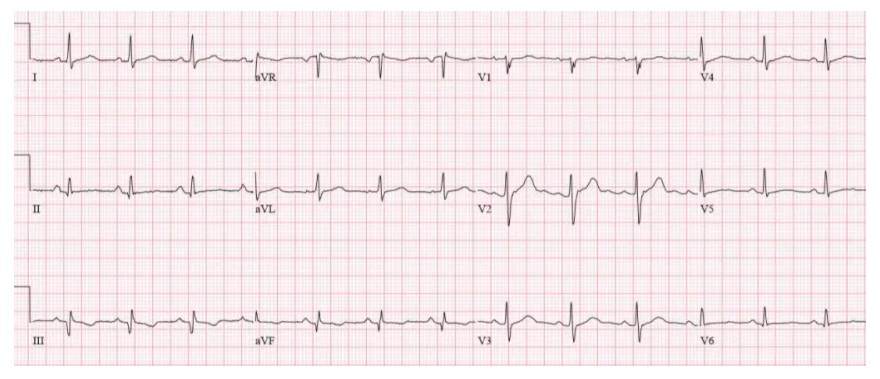
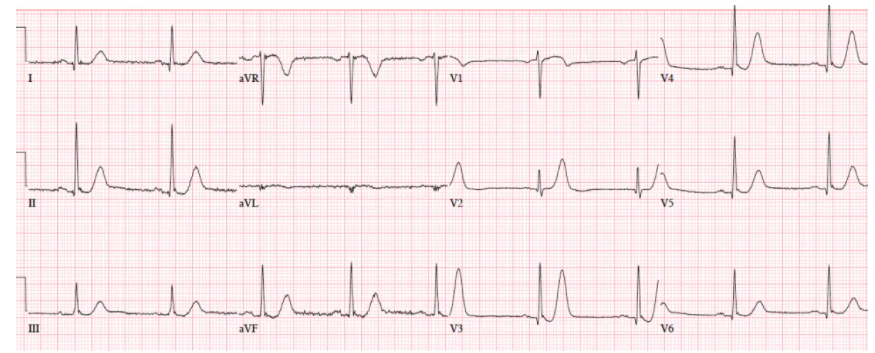 So Dr. McLaren’s analysis of the above (second new) ECG is:
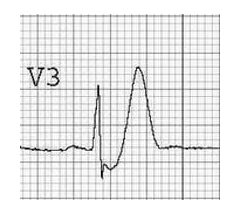
Read by the machine as “nonspecific”, but the deWinter T waves* in V3-4 (ST depression followed by tall symmetric T waves) are very specific for LAD occlusion. Cath lab activated: 100% mid-LAD occlusion. First trop negative, peak 50,000.
*For Case 4, I searched for De Winter T Waves and found the link De Winter T Wave,
Ed Burns Feb 7, 2021 from Life In The Fast Lane. Here are excerpts:
Clinical Significance of De Winter T Waves
The de Winter ECG pattern is an anterior STEMI equivalent that presents without obvious ST segment elevation. First reported by first reported de Winter in 2008
- Key diagnostic features include ST depression and peaked T waves in the precordial leads.
- The de Winter pattern is seen in ~2% of acute LAD occlusions and is under-recognised by clinicians.
- Unfamiliarity with this high-risk ECG pattern may lead to under-treatment (e.g. failure of cath lab activation), with attendant negative effects on morbidity and mortality.
Background
- The de Winter ECG pattern was first reported in a 2008 case series by de Winter RJ, Verouden NJ, Wellens HJ et al. They observed this ECG pattern in 30 / 1532 patients with acute LAD occlusions (2% of cases).
- Verounden and colleagues replicated this finding in a 2009 case series. They found a de Winter ECG pattern in 35 / 1890 patients requiring PCI to the LAD (2% of cases). Patients with the de Winter ECG pattern were younger, more likely to be male and with a higher incidence of hypercholesterolaemia compared to patients with a classic STEMI pattern.
- There is now growing evidence to suggest that the de Winter ECG pattern is highly predictive of acute LAD occlusion.
- Some authors have proposed that the de Winter pattern should be considered a “STEMI equivalent”, and that patients with chest pain and this ECG pattern should receive emergent reperfusion therapy with PCI or thrombolysis.
In patients presenting with chest pain, ST-segment depression at the J-point with upsloping ST-segments and tall, symmetrical T-waves in the precordial leads of the 12-lead ECG signifies proximal LAD artery occlusion. It is important for cardiologists and emergency care physicians to recognise this distinct ECG pattern, so they can triage such patients for immediate reperfusion therapy
Verouden NJ 2009
Diagnostic Criteria
- Tall, prominent, symmetric T waves in the precordial leads
- Upsloping ST segment depression >1mm at the J-point in the precordial leads
- Absence of ST elevation in the precordial leads
- ST segment elevation (0.5mm-1mm) in aVR
- “Normal” STEMI morphology may precede or follow the deWinter pattern
Original reports of the de Winter pattern suggested that the ECG did not change or evolve until the culprit artery had been opened. Since then, cases have been reported where the deWinter pattern evolved from, or evolved to a “classic” anterior STEMI.
Note to myself: Now go to the LITFL post and review the five excellent ECG examples of De Winter T-Waves.
Returning now to ECG 5 from ECG Cases 1:
Patient 5: 70yo with 6hrs on/off chest tightness radiating to the arm now constant. Old then new ECG
Old ECG of Case 5
Here’s my analysis of the old ECG:
Sinus brady/N conduction/N axis/N R-wave progression/No VH or chamber enlargement, low voltage in the anterior leads/No ST-T changes
New ECG of Case 5
My analysis of the new Case 5 ECG above:
Sinus brady/N electrical/N axis/R early transition/ST elevation and tall T wave in V2 and V3.
Dr. McLaren’s analysis:
There’s mild concave ST elevation in lead V2-3 which doesn’t meet STEMI criteria. But this is new compared to previous, along with hyperacute T waves in V2-3 and mild ST depression laterally. When trop came back positive an hour later, repeat ECG below showed straightening of the ST segments, and the cath lab was activated: 100% distal LAD occlusion.
So here’s the second Case 5 new ECG below:

Patient 6: 75yo one day chest pain radiating to bilateral shoulders. Old then new ECG
Old ECG 6
My interpretation of old ECG 6: NSR/N Electrical Conduction/N axis/N R-wave progression/No hypertrophy/N ST-T waves
New ECG 6
My interpretation of new ECG 6: NSR/N electrical conduction/Normal axis/N R-wave progression/No hypertrophy/N ST-T wave changes.
And Dr. McLaren’s interpretation of old and new ECG 6:
There’s barely 1mm of ST elevation in aVL only (no STEMI criteria), but this is large compared to its small QRS complex, and there’s mild reciprocal ST depression inferiorly, and pseudonormalized ST segment in V3. Concerned about the patient’s symptoms and the new ischemic changes, the physician activated the cath lab: circumflex occlusion.
So I totally missed Case 6, but that’s why I’m going through the cases.
Patient 7: 55yo history RCA stent with 30 minutes chest pain radiating to the arm. Old then new ECG
Old ECG 7:
My interpretation of old ECG 7: NSR/N electrical conduction/N axis/N R-wave progression/No chamber enlargement/Qs in III and aVF with T wave inversion
New ECG 7:

My interpretation of new ECG 7: now with 1 mm of ST elevation and upright T waves in II and aVF.
And Dr. McLaren’s interpretation: NSR, normal conduction/axis, R wave, no hypertrophy. There’s an old Q wave from the prior MI. But there is now mild ST elevation in III/AVF with reciprocal ST depression in aVL (which is very sensitive for inferior MI), the inverted T waves in III/aVF are now upright (pseudonormalization), and there is relative ST depression (pseudonormalization) in V2–all concerning for posterolateral ischemia. Cath lab activated: 100% occlusion at the stent. First trop negative, peak 8,000.


