
The following seven charts from the article Resource (1) in Resources below well summarize the article:
The Seven Charts are:
- Fig. 1: Decision Cycle For Patient-Centered Glycaemic Management In Type 2 Diabetes
- Fig. 2: Glucose-Lowering Medication in Type 2 Diabetes – Overall Considerations
- Fig. 3: Choosing Glucose-Lowering Medication in Those With Atherosclerotic Cardiovascular Disease (ASCVD) Or Chronic Kidney Disease (CKD)
- Fig. 4: Choosing Glucose-Lowering Medication If Compelling Need To Minimize Weight Gain Or Promote Weight Loss
- Fig. 5: Choosing Glucose-Lowering Medication If Compelling Need To Minimize Hypoglycemia
- Fig. 6: Choosing Glucose Lowering Medication If Cost Is A Major Issue
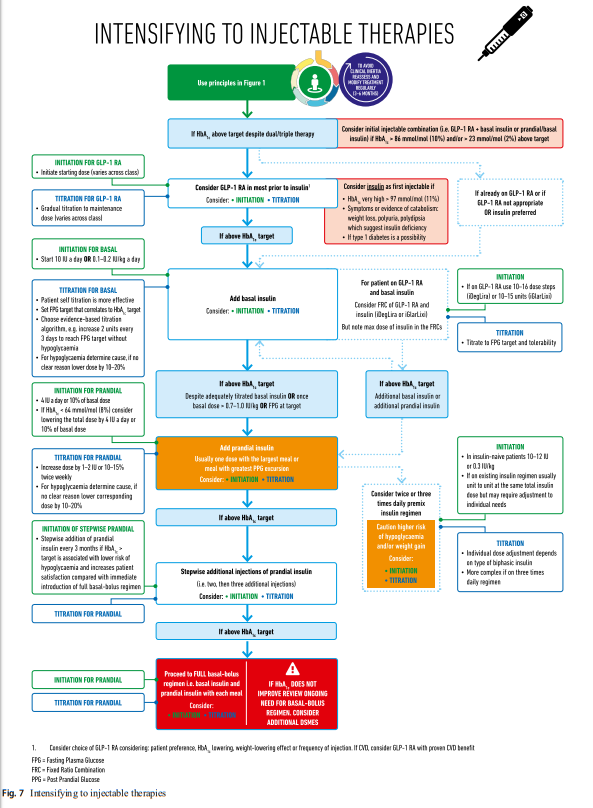
- Fig. 7: Intensifying To Injectable Therapies
Fig. 1
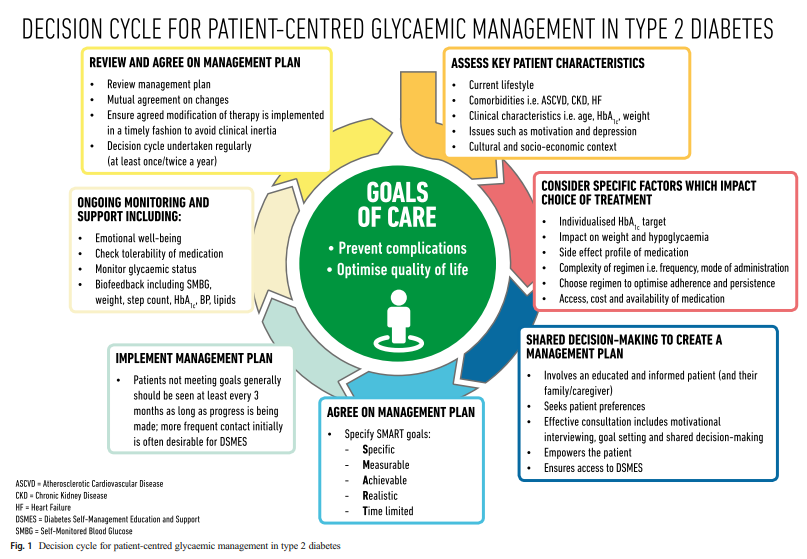
Fig. 2
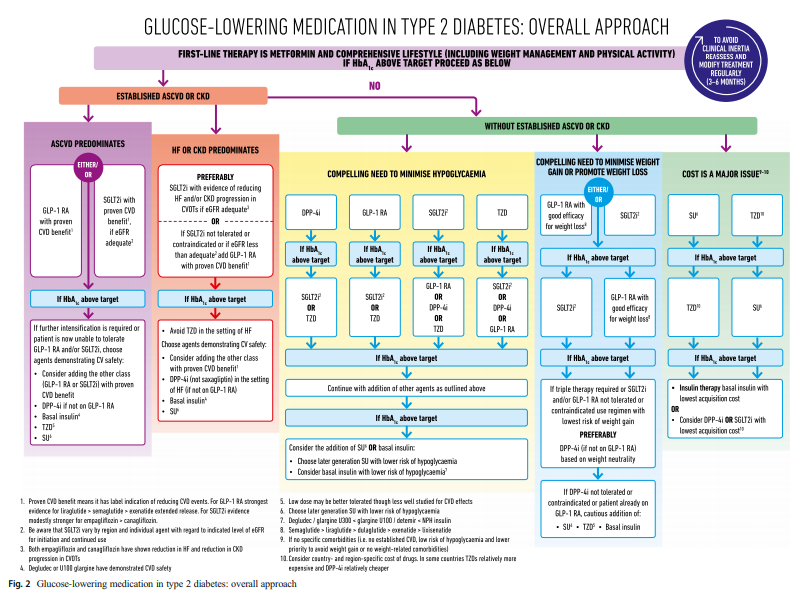
Fig. 3
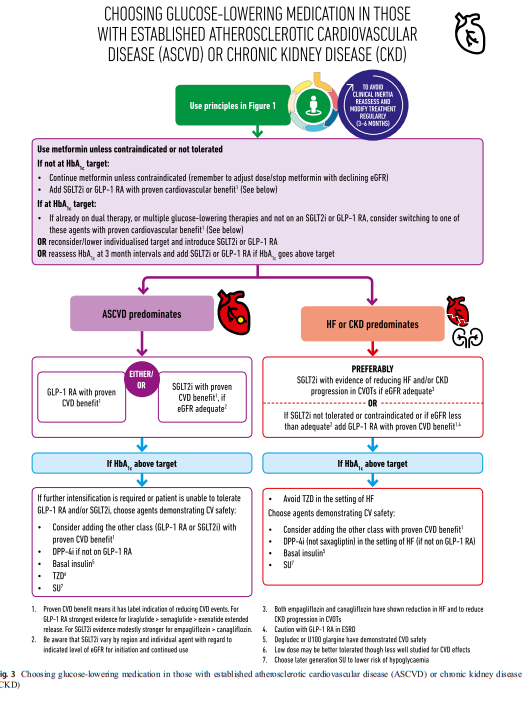
Fig. 4
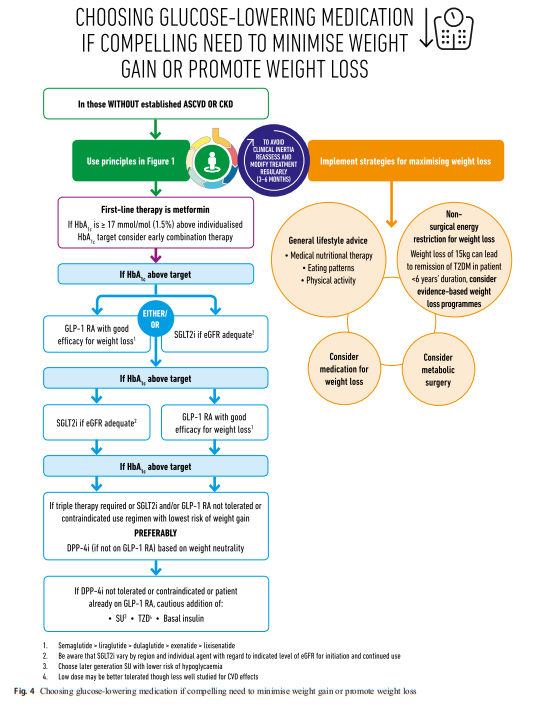
Fig. 5
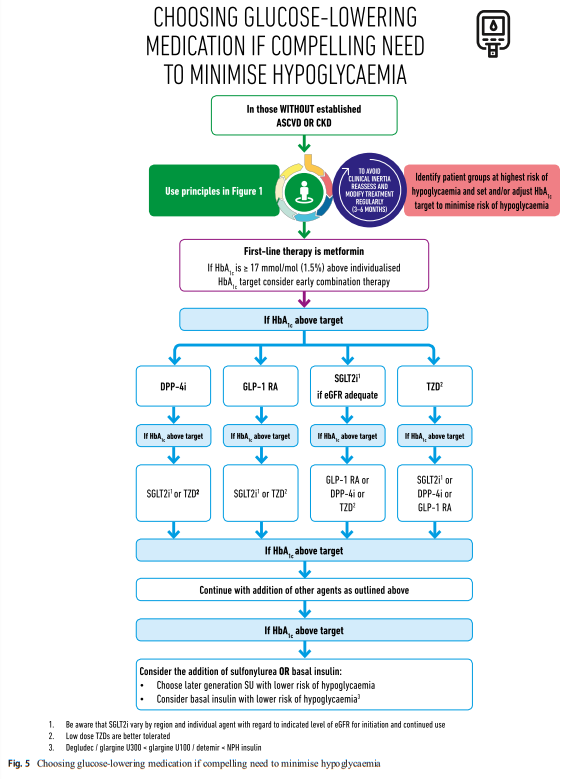
Fig. 6
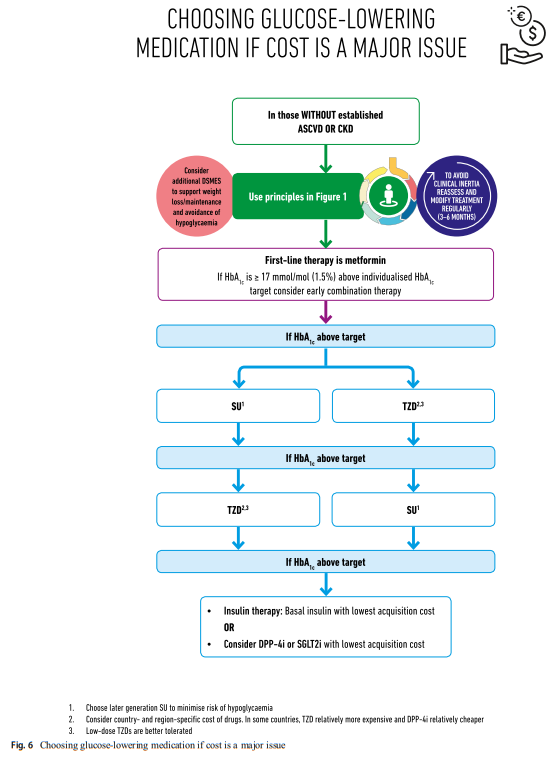
Fig. 7
Resources:
(1) Management of hyperglycaemia in type 2 diabetes, 2018. A consensus report by the American Diabetes Association (ADA) and the European Association for the Study of Diabetes (EASD) [PubMed Abstract] [Full Text HTML] [Full Text PDF].
(2) Cardiovascular disease and glycemic control in type 2 diabetes: now that the dust is settling from large clinical trials [PubMed Abstract] [Full Text HTML] [Full Text PDF]. Ann N Y Acad Sci. 2013 Apr;1281:36-50. doi: 10.1111/nyas.12044. Epub 2013 Feb 6.
(3) Hemoglobin A1c Targets for Glycemic Control With Pharmacologic Therapy for Nonpregnant Adults With Type 2 Diabetes Mellitus: A Guidance Statement Update From the American College of Physicians [PubMed Abstract] [Full Text HTML] [Full Text PDF]. Ann Intern Med. 2018 Apr 17;168(8):569-576. doi: 10.7326/M17-0939. Epub 2018 Mar 6.


