
What follows are excerpts from Resource (1) below:
What is a Likelihood Ratio?
Likelihood ratios (LR) are used to assess two things: 1) the potential utility of a particular diagnostic test, and 2) how likely it is that a patient has a disease or condition. LRs are basically a ratio of the probability that a test result is correct to the probability that the test result is incorrect. The sensitivity and specificity of the test are the numbers used to generate a LR, which is calculated for both positive and negative test results and is expressed as ‘LR+’ and ‘LR-‘, respectively. The calculations are based on the following formulas:
LR+ = sensitivity / 1- specificity
LR- = 1- sensitivity / specificityIn its simplest expression, LR+ is equivalent to the probability that a person with the disease tested positive for the disease (true positive) divided by the probability that a person without the disease tested positive for the disease (false positive). LR- is equivalent to the probability that a person with the disease tested negative for the disease (false negative) divided by the probability that a person without the disease tested negative for the disease (true negative).
Bayes’ Theorem and Pre-Test Probability
LRs are commonly used in decision-making based on Bayes’ Theorem. Bayes’ Theorem is basically a mathematical recognition of context as an important factor in decision making. In other words no diagnostic test is perfect, and because every test will be wrong sometimes the likelihood that a test is right will depend heavily upon its context. This approach requires an estimate of the probability of a disease before any test is ordered (i.e. the ‘pre-test probability’).
Thus, the calculation of how likely it is that someone has a disease is based on a pre-test probability (typically estimated by the clinician), with LRs applied to this number. A critical, and often discussed, part of this process is the estimation of pre-test probability of a disease, something that can vary by clinician, by setting, by location, and many other factors.
However, the estimation of pre-test probability is typically subjective, based on the clinician’s experience and gestalt. Thus the pre-test probability estimate will often vary based on the clinician, which means that clinical judgment remains a critical part of the process of diagnosis, even when LRs for a given test are known.
For the mathematically inclined one can arrive at post-test probability by multiplying pre-test odds (O = P ⁄ [1 – P]) by LR+ or LR- and converting the resultant post-test odds to post-test probability (P = O/[1 + O]). Alternatively, and much more commonly, the Fagan nomogram can show the post-test probability of a disease if the pre-test probability and the LR are known (Figure).
Keeping this model in mind, it is obvious that a test could only be useful if its LR can significantly alter the probability of a diagnosis. Thus if the LR value is 1 then the value of the diagnostic test is of no practical significance. The further away the LR value is from 1, the more useful it will be.
How to Use Our Web-Based LR Tool
Each disease/condition has a corresponding page with LRs for both positive and negative findings, as extracted from the highest quality available literature on the topic.
The following are excerpts from Resource (2) below:
Likelihood ratios (LRs) constitute one of the best ways to measure and express diagnostic accuracy. Despite their many advantages, however, LRs are rarely used, primarily because interpreting them requires a calculator to convert back and forth between probability of disease (a term familiar to all clinicians) and odds of disease (a term mysterious to most people other than statisticians and epidemiologists). Although nomograms can circumvent these calculations,1,2 these nomograms are rarely accessible at the bedside and are seldom used. This article describes a simpler method of interpreting LRs, one that avoids calculators, nomograms, and conversions to odds of disease, and one that illustrates how LRs can refine diagnostic decisions at the bedside.
[The article has a section on how to perform the calculations to determine the LRs. These are somewhat complex and the authors give us an easier method.]
A SIMPLER METHOD OF APPLYING LRS
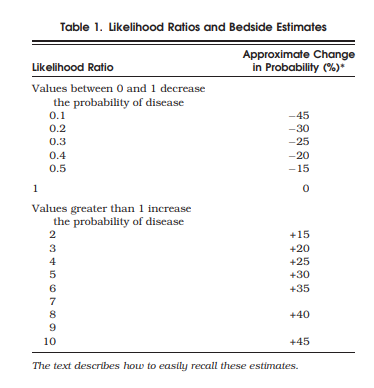
A simpler method avoids these calculations by using the estimates shown in Table 1. According to these estimates, which are independent of pretest probability, a finding with an LR of 2.0 increases the probability of disease about 15%, and a finding with an LR of 0.3 decreases probability of disease about 25%. Therefore, bulging flanks increases the probability of ascites from 40% to about 55% (i.e., 40 + 15 = 55%, only 2% lower than the calculated answer), and flank tympany decreases it from 40% to about 15% (i.e., 40 − 25 = 15%, only 2% lower than the calculated answer). As long as the clinician rounds estimates of posttest probability more than 100% to an even 100% and those of less than 0% to an even 0%, these estimates are accurate to within 10% of the calculated answer for all pretest probabilities between 10% and 90%. The average error is only 4%.
Table 1 is easy to recall at the bedside by simply remembering 3 specific LRs—2, 5, and 10—and the first 3 multiples of 15 (i.e., 15, 30, and 45). An LR of 2 increases probability 15%, one of 5 increases it 30%, and one of 10 increases it 45%. For those LRs between 0 and 1, the clinician simply inverts 2, 5, and 10 (i.e., 1/2 = 0.5, 1/5 = 0.2, 1/10 = 0.1). Just as the LR of 2.0 increases probability 15%, its inverse, 0.5, decreases probability 15%. Similarly, an LR of 0.2 (the inverse of 5) decreases probability 30%, and a LR of 0.1 (the inverse of 10) decreases it 45%. These benchmark LRs can be used to approximate the remainder of Table 1.
Although this method is inaccurate for pretest probabilities less than 10% or greater than 90%, this is not a disadvantage, because these polar extremes of probability indicate diagnostic certainty for most clinical problems, making it unnecessary to order further tests (and apply additional LRs).

Resources:
(1) Diagnostics and Likelihood Ratios, Explained from The NNT – “Quick summaries of evidence-based medicine”, accessed 11-20-2018.
(2) Simplifying Likelihood Ratios [PubMed Abstract] [Full Text HTML] [Full Text PDF].J Gen Intern Med. 2002 Aug; 17(8): 647–650.
doi: [10.1046/j.1525-1497.2002.10750.x]


