In this post, I link to and excerpt from Comprehensive Assessment of Fluid Status by Point-of-Care Ultrasonography [PubMed Abstract] [Full-Text HTML] [Full-Text PDF]. Kidney360 August 2021, 2 (8) 1326-1338.
The above article is an outstanding resource on assessing fluid status with POCUS.
It is worth reviewing over and over. My excerpts of the article just scratch the service and are really just so I can do a very rapid review of the subject.
In addition to the excellent resource above, here are some other excellent POCUS resources that I strongly recommend:
- POCUS ASSESSMENT OF VENOUS CONGESTION: TIME TO JOIN THE DARK, Vimeo video of Dr. Phillipe Rola’s Mayo Clinic’s Critical Care Grand Rounds of October 8, 2020.
- This lecture by Dr. Rola is awesome and although it is 50 minutes long it is worth every single minute. If you love learning Medicine, you will love this lecture.
- Link To Dr. Rola’s Grand Rounds “POCUS Assessment Of Venous Congestion” With Link To An Additional Resource
Posted on November 2, 2020 by Tom Wade MD- Note: I made this post to summarize some of Dr. Rola’s teaching points but it is in no way a substitute for Dr. Rola’s outstanding lecture.
- Link To Vimeo Video “The Fastest Way to Diagnose RV Dysfunction” And To An Additional Resource
Posted on November 2, 2020 by Tom Wade MD
And now on to this awesome article
All that follows is from the Comprehensive Assessment of Fluid Status by Point-of-Care Ultrasonography [PubMed Abstract] [Full-Text HTML] [Full-Text PDF]. Kidney360 August 2021, 2 (8) 1326-1338.
Abstract
The management of complex fluid and electrolyte disorders is central to the practice of nephrologists. The sensitivity
of physical examination alone to determine fluid status is limited, precluding accurate clinical decision making.
Point-of-care ultrasonography (POCUS) is emerging as a valuable, noninvasive, bedside diagnostic tool for objective
evaluation of physiologic and hemodynamic parameters related tofluid status, tolerance, and responsiveness. Rapid
bedside sonographic evaluation can obtain qualitative data on cardiac function and quantitative data on pulmonary
congestion. Advanced POCUS, including goal-directed Doppler echocardiography, provides additional
quantitative information, including flow velocities and pressures across the cardiac structures. Recently, abnormal
Doppler flow patterns in abdominal organs secondary to increased right atrial pressure have been linked to
congestive organ damage, adding another component to the hemodynamic assessment. Integrating POCUSfindings
with clinical and laboratory data can further elucidate a patient’s hemodynamic status. This drives decisions
regarding crystalloid administration or, conversely, diuresis or ultrafiltration and allows tailored therapy for
individual patients. In this article, we provide an overview of the focused assessment of cardiovascular function and
pulmonary and venous congestion using POCUS and review relevant literature.KIDNEY360 2: 1326–1338, 2021.
Case
A 63-year-old man with a medical history of hypertension, obesity, and heart failure (HF) with reduced
ejection fraction presents to the nephrology clinic for
assessment of an elevated serum creatinine. His baseline
serum creatinine was approximately 0.6–0.8 mg/dl. He
complains of abdominal distension, loose stools, and
dyspnea on exertion. Medications include carvedilol,
lisinopril, isosorbide mononitrate, and hydralazine.
Diuretics were held by the referring physician due to a
rise in creatinine. Physical examination demonstrates
BP of 92/59 mm Hg with a heart rate of 65 bpm. Cardiopulmonary exam reveals pedal edema, but no obvious
jugular venous distention, rales, or third heart sound.
Urine sediment is bland. Review of chest roentgenogram obtained in the primary care setting shows no
evidence of pulmonary edema or pleural effusions. Laboratory studies show stable serum creatinine 1.4 mg/dl
after discontinuation of diuretics. What is the next step?Introduction
Assessment of fluid and hemodynamic status is a
critical skill for nephrologists, central to almost every
consult from hypertension and electrolyte disorders to
management of AKI and ESKD. Fluid status assessment
has a storied tradition in which physical exam signs of
jugular venous distention, third heart sounds, rales,
and peripheral edema have been learned and reproduced by generations of physicians. These signs are helpful in extreme cases, but are insensitive for the detection of volume overload (1). Radiographic signs of volume overload, such as pleural effusions and Kerley B lines, aid in fluid status assessment, but lack sensitivity (2). Natriuretic peptides and pulmonary artery
catheters also have limitations (3,4). In the past 30 years, point-of-care ultrasonography (POCUS) has expanded from a niche subspecialty skill to a cornerstone of bedside diagnosis (5,6). Ultrasound allows us to directly
visualize the body in a way that was previously inaccessible. POCUS involves answering focused clinical questions using bedside ultrasonography and increases the sensitivity of the conventional physical examination (7–12). As we move forward, ultrasonographic indicators of fluid status are being developed and validated. …, POCUS findings should be interpreted in conjunction with other clinical parameters—such as vital signs, body weight, mucous membrane examination, capillary refill time, and axillary moisture—and not viewed as an alternative to physical examination or standard imaging studies.We describe the most well-validated indices of fluid
status: focused sonographic assessment of the heart,
abdominal veins, and lungs (the pump-pipes-leaks
approach) (13) to gain insight into systemic hemodynamics and guide fluid management decisions.
Lung Ultrasound
Extravascular lung water (EVLW), or the fluid content in
the lung interstitium, is an important indicator of fluid status,
often guiding management decisions in clinical practice. It
essentially depends on left ventricular (LV) filling pressures
and permeability of the pulmonary vasculature. In the recent
past, lung ultrasound (LUS) has emerged as a valuable bedside tool to detect pulmonary congestion, even before it is
clinically apparent (14). Moreover, LUS is technically the
least challenging of all of the sonographic applications
described in this review. There are data suggesting that
nephrologists can be effectively trained to measure EVLW
using LUS by an entirely internet-based program (15).Interpretation
LUS primarily involves interpretation of the artifacts
rather than visualization of the pulmonary parenchyma
because air is strongly reflective to the ultrasound beam. In
normal aerated lung, the only detectable structure is the
pleura, which appears as a shimmering hyperechoic (bright)
horizontal line in between the rib shadows. The shimmer or
synchronous horizontal movement with respiration denotes
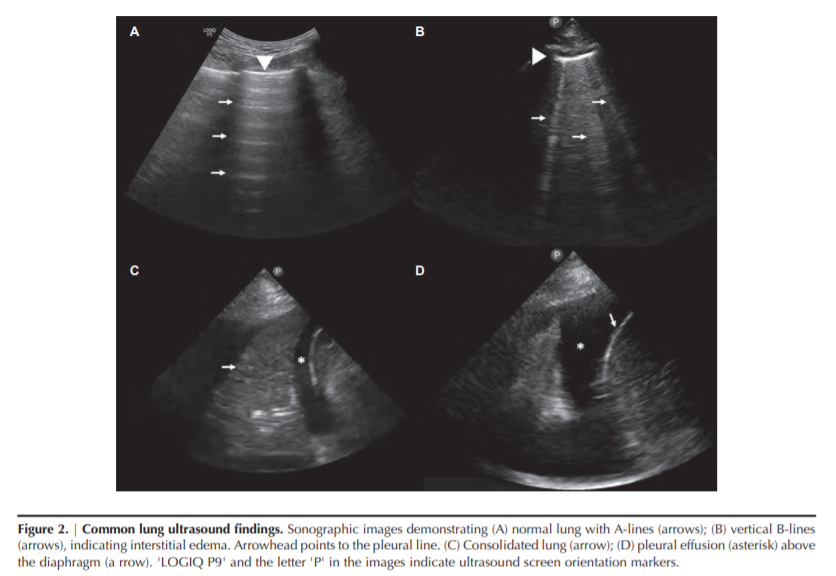
pleural sliding. A-lines are equidistant hyperechoic horizontal lines seen on a normal LUS (Figure 2A). These are reverberation artifacts formed due to multiple reflections of the
ultrasound beam between the transducer and the pleura
with underlying air-filled lung. When the air content in
the lung decreases due to transudate or exudate in the interstitium, vertical hyperechoic artifacts are seen, termed the
B-lines (Figure 2B). These are the ultrasound equivalents of
the Kerley B lines seen on a chest radiograph, and they provide a semiquantitative estimate of the amount of
EVLW. B-lines arise from the pleural line, extend to the
end of the image without fading, and move synchronously
with lung sliding. A positive “B-line region or zone” is
defined as the presence of three or more B-lines in a longitudinal plane between two ribs. Two or more positive regions
bilaterally constitutes “interstitial syndrome” and indicates
diffuse pulmonary edema (16). B-lines can also be seen in
conditions other than cardiogenic pulmonary edema—such
as focal pneumonia, acute respiratory distress syndrome,
pulmonary fibrosis, and contusion—and, hence, should be
interpreted in the appropriate clinical context. These conditions are typically associated with thickened/irregular pleural line and nonhomogeneous distribution of B-lines. When
the air content in the lung further decreases, such as in alveolar consolidation, lung parenchyma can be visualized on
ultrasound similarly to that of liver and spleen (Figure 2C).
In contrast, pleural effusion appears as an anechoic (black)
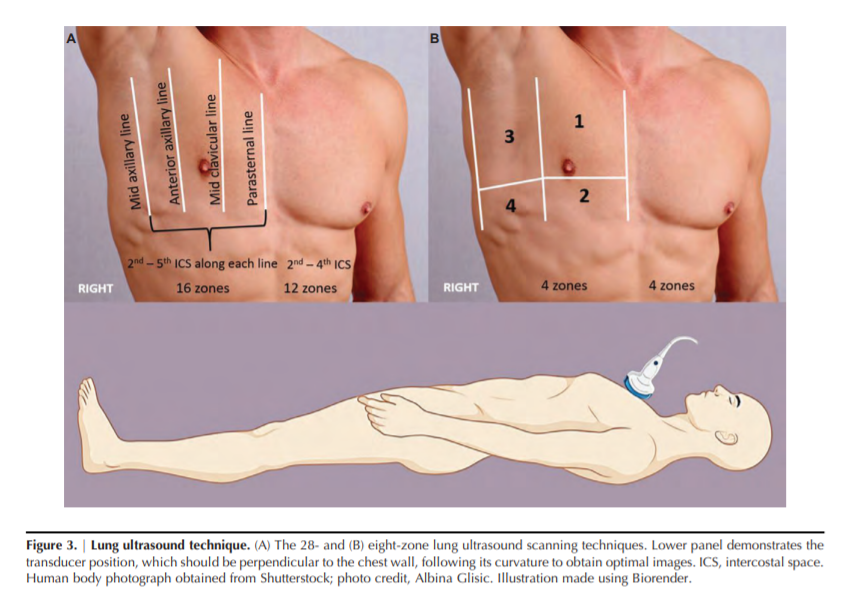
space above the diaphragm, typically surrounding the atelectatic or consolidated lung (Figure 2D).…, in routine clinical practice, an eight-zone scanning technique is frequently used in which two anterior and two lateral areas are examined on each hemithorax (Figure 3B) (17). Recently, Torino et al. (18) showed that the eight-zone technique correlates well with the classic 28-zone score and also retains its prognostic significance (discussed below).
Diagnostic Performance
The diagnostic performance of LUS to detect pulmonary
congestion is far superior compared with auscultation. For
example, in a study including 79 patients receiving hemodialysis who were deemed to be at higher cardiovascular risk,
only about half of those with severe congestion on LUS
(defined as .30 B-lines on a 28-zone scan) had crackles on
lung auscultation. Likewise, in patients with moderate congestion on LUS (15 to ,30 B-lines), the prevalence of crackles
was only 31% (1).In patients with acute decompensated heart failure, LUS
was shown to be more sensitive for detection of pulmonary
edema than chest radiography, which is the typical
first-line imaging (2). In addition, LUS has demonstrated
substantial correlation with cardiac catheterization–derived
LV end-diastolic pressure, making it a valuable adjunct to
echocardiography and clinical variables in the management
of patients with HF (19).Prognostic Significance
LUS-detected pulmonary congestion is associated with
adverse outcomes, even in patients who are asymptomatic.
For instance, in a multicenter observational study including
392 patients with ESKD who were on hemodialysis, those
with very severe congestion (.60 B-lines on a 28-zone
scan) had a 4.2-fold risk of death (hazard ratio, 4.20; 95%
CI, 2.45 to 7.23) and a 3.2-fold risk of cardiac events (hazard
ratio, 3.20; 95% CI, 1.75 to 5.88) after adjusting for HF class
and other risk factors compared with those having mild or
no congestion (,15 B-lines) (20)Analogously, in the context of HF, residual lung congestion at hospital discharge and in the outpatient clinic has been shown to be a strong predictor of outcome (21–23).
Focused Cardiac Assessment
Hemodynamic assessment is predicated on the basic
knowledge of cardiac function and the presence of pathologies. In contrast to referral echocardiography, focused
cardiac ultrasound (FOCUS) is a limited study aimed at
answering specific questions, such as evaluation of the left
and right ventricular function and presence or absence of
pericardial effusions. Most commonly, FOCUS consists of a
series of five, two-dimensional, echocardiographic clips
without spectral Doppler, in which images of the heart are
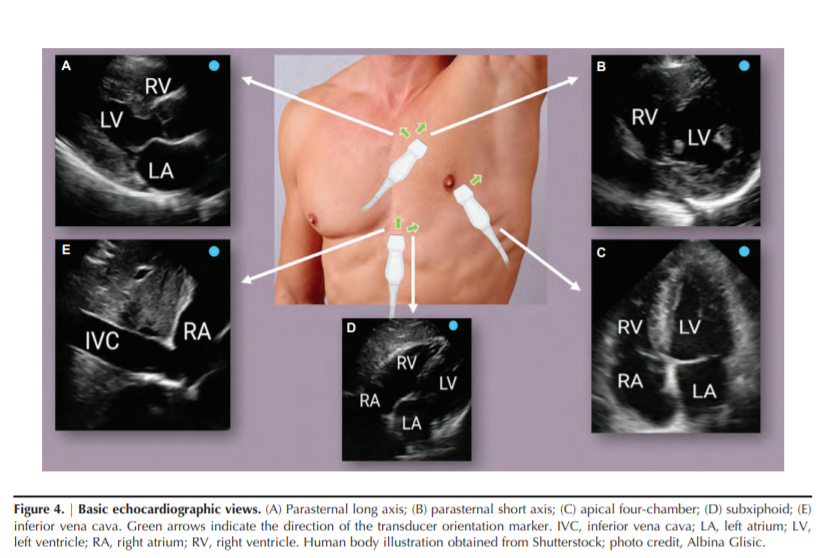
obtained in orthogonal planes to provide the relevant physiologic information (detailed in Figure 4) (32,33). Further
clues to fluid status can be gleaned from additional studies
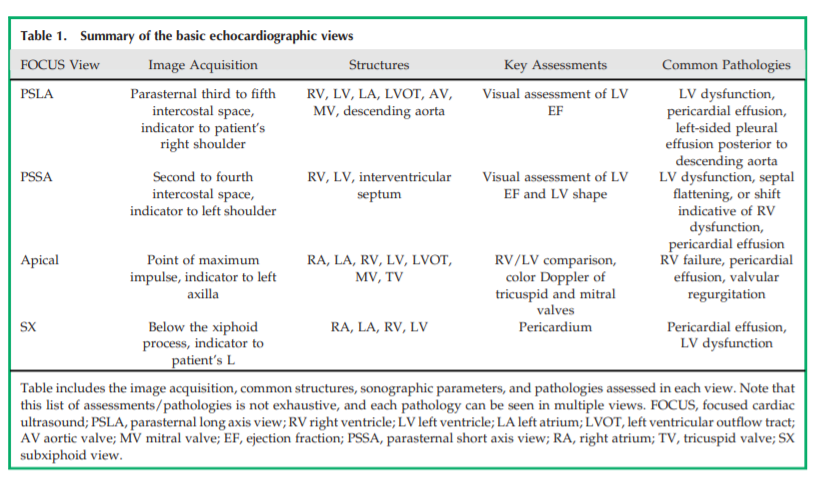
using Doppler ultrasonography. Table 1 summarizes the
image acquisition of basic echocardiographic views, common structures visualized, sonographic parameters, and
pathologies assessed in each view.
Pericardial Effusion
Pericardial effusion is an important cause of hypotension
and hemodynamic compromise, which can be quickly identified on FOCUS. It appears as an anechoic (black) space
between the two pericardial layers. Parasternal long-axis
and subcostal views allow better visualization of the
effusion, although it is generally identifiable on all of the
standard FOCUS views (Figure 5A). In terms of severity, separation between the pericardial layers in diastole of ,1 cm is
considered mild, whereas 1–2 cm is considered moderate
and .2 cm is considered severe effusion (34).LV Systolic Dysfunction
Qualitative estimation or “eyeballing” of the LV ejection
fraction is another key component of FOCUS, which involves
observing wall thickening and motion during the cardiac
cycle. In general, the LV walls should approximate by one
fourth or more in parasternal views. In patients with
depressed LV function, both wall thickening and inward
motion are decreased. Conversely, a hyperdynamic ventricle, i.e., where ventricular walls/papillary muscles in the
parasternal short axis view almost touch at end-systole, is
indicative of volume depletion in the appropriate clinical
context.
Relative Chamber Size
A normal right ventricle (RV) cavity diameter is less than
two thirds of the LV and can quickly dilate with pressure
or volume overload. Apical four-chamber and parasternal
short axis views are good for assessing this. With volume
overload, the RV becomes dilated, and the interventricular
septum is flattened in diastole, giving the appearance of
“D” to the LV in the parasternal short axis view. This is called
the “D-sign” (Figure 5B). Although such patients are hypotensive, empirically administering intravenous fluids causes further compromise of the LV cavity and reduced cardiac
output.Right Atrial Pressure
Inferior vena cava (IVC) ultrasound is used to estimate
right atrial pressure (RAP) and get an idea of the resistance
to venous return.In patients who are spontaneously breathing, the IVC collapses during inspiration due to negative intrathoracic pressure. An IVC diameter of ≤ 2.1 cm and collapsibility of > 50% with a sniff indicates normal RAP of 3 mm Hg (0–5 mm Hg), an IVC diameter of > 2.1 cm with < 50% inspiratory collapse indicates high RAP of 15 mm Hg (10–20 mm Hg), and scenarios in between correspond to an intermediate value of 8 mm Hg (5–10 mm Hg) (35).
Figure 5, C and D, demonstrates sonographic images of large
and small IVC obtained from a patient with HF and volume
depletion, respectively.
However, these cutoffs [the ones above] cannot be applied in patients who are mechanically ventilated because the IVC is dilated at baseline due to positive pressure However, these cutoffs cannot be applied in patients who are mechanically ventilated because the IVC is dilated at baseline due to positive pressure ventilation and may not collapse at all during respiration.
Although novice POCUS users are enthusiastic about IVC
ultrasound because it is relatively easy to learn, interpreting
it in isolation is subject to numerous pitfalls. For example,
small collapsible IVC is seen in normal state of health and
equating it with volume depletion, without considering the
clinical context, leads to unnecessary fluid administration.Moreover, the magnitude of the respiratory effort significantly affects collapsibility (for example, a frail elderlywoman versus a muscular young man), altering the interpretation.
Furthermore, technical factors—such as obesity, surgical dressings, increased intra-abdominal pressure, or mistaking aorta or dilated bowel for IVC—can result in errors.
Depending on how the ultrasound beam is aimed, it may not depict the true diameter of the vessel.* Notably, studies demonstrate moderate to poor inter-rater agreement
between IVC measurements (36,37).


*Dr. Rola, of Thinking Critical Care, reminds us that we must assess the IVC for collapsibility in both the long axis and in the short axis to avoid making errors. Please see, Link To Dr. Rola’s Grand Rounds “POCUS Assessment Of Venous Congestion” With Link To An Additional Resource
Posted on November 2, 2020 by Tom Wade MD
Although IVC is a good indicator of central venous pressure (CVP), it is not reliable to assess fluid responsiveness (38). Therefore, IVC ultrasound should be interpreted in conjunction with other POCUS findings and the overall clinical picture.
Venous Doppler
Organ dysfunction in HF is closely related to venous congestion (40). CVP is the strongest hemodynamic determinant for the development of worsening renal function in patients with decompensated HF (41). Normal and abnormal patterns of flow in abdominal and central veins result from retrograde transmission of CVP (42).
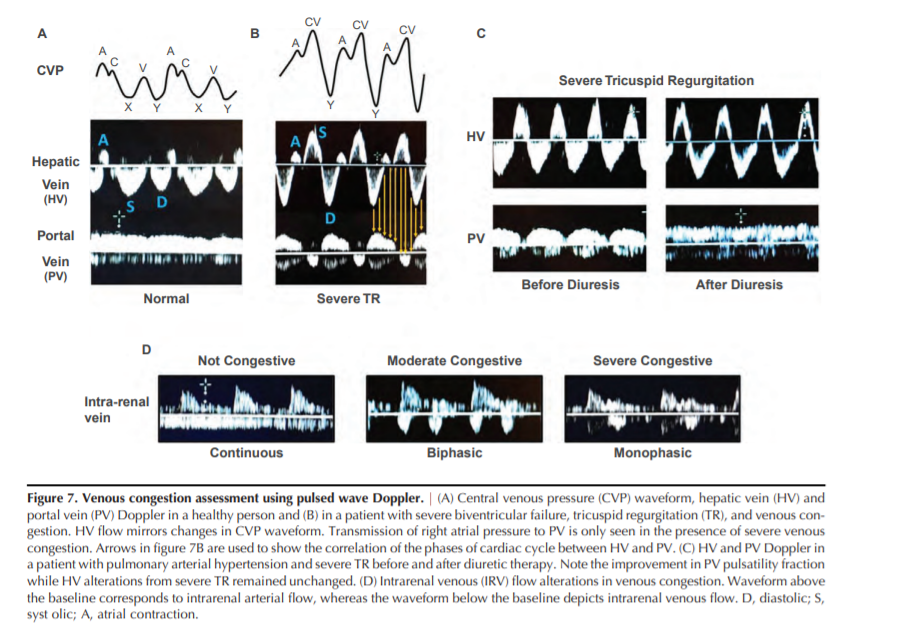
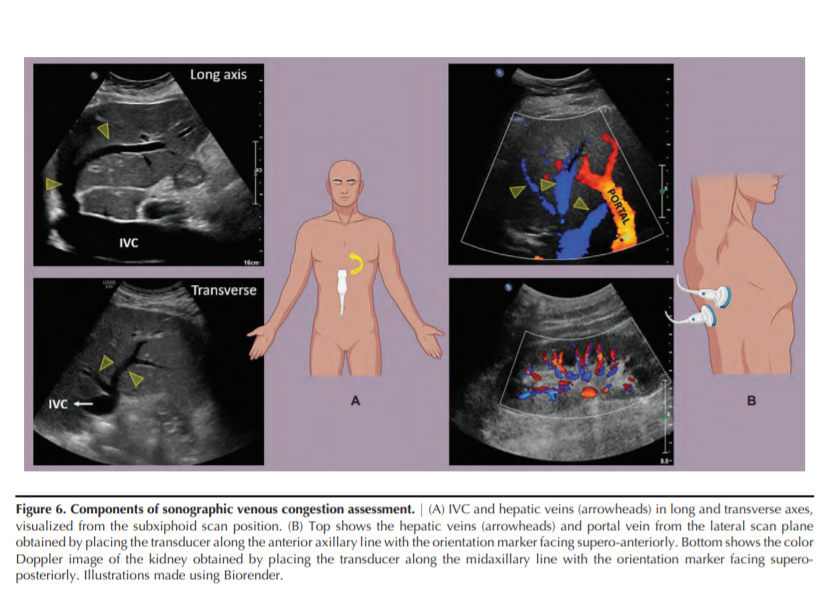
POCUS can enhance the clinical evaluation of venous congestion using venous Doppler in addition to IVC ultrasound (43,44). Figure 6 illustrates the technique of obtaining the sonographic images of hepatic, portal, and intrarenal veins.
Hepatic Vein Doppler
Blood flow in the hepatic veins (HVs) is pulsatile, and
changes in its velocity reflect changes in RAP. The normal
HV flow pattern consists of two antegrade waves (a larger
systolic [S] and a smaller diastolic [D] wave corresponding
to CVP “X” and “Y” descent, respectively) and one or two
retrograde waves (a larger “A” wave and smaller “V”
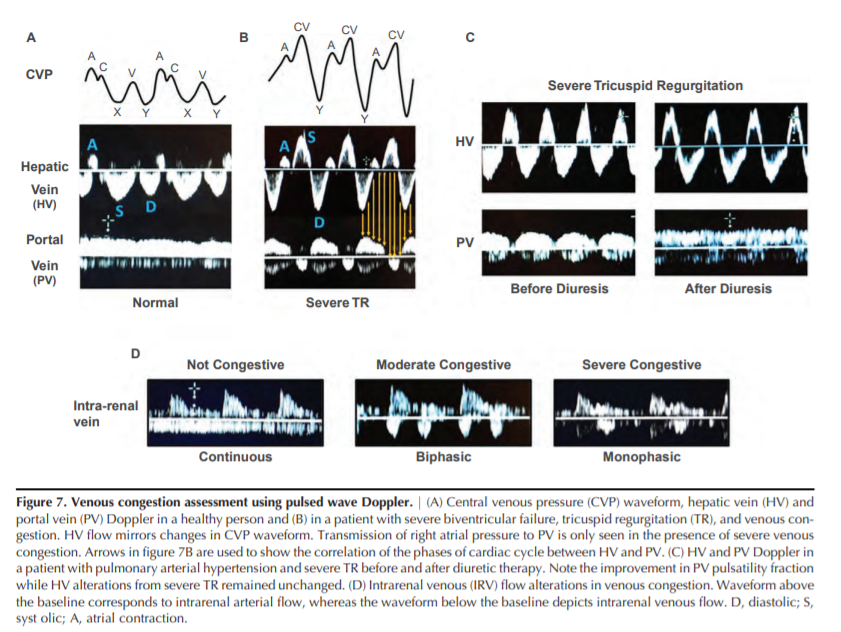
wave corresponding to CVP “A” and “V” waves, respectively). Frequently, the V wave is not seen (Figure 7A) (26).
Understanding the origin of hepatic flow waves aids in
understanding common pathologic alterations. For example,
severe pulmonary hypertension can manifest as prominent
A waves and/or decreased D wave amplitude because of
an increase in RV end-diastolic pressure (45). Systolic dysfunction of the RV and tricuspid regurgitation (TR) both alterthe RAP during ventricular systole, leading to progressive
decrease in the peak velocity of the S wave (46). In addition,
severe TR can cause S wave reversal (Figure 7B) (47). Thus,
HV Doppler provides relevant information about the filling
pattern of the RA.
Start at Portal Vein Doppler
Portal Vein Doppler
As opposed to HV flow, the splanchnic circulation is an
isolated vascular unit protected from the systemic circulation
by the resistance of postsinusoidal sphincters (48). Thus, normal portal flow is continuous or only mildly pulsatile (Figure
7A) (49). However, pathologic increases in RAP can be transmitted through liver sinusoids into the portal vein (Figure
7B) (50). Portal vein pulsatility was originally described in
patients with severe TR (51), but has now been described
in multiple conditions associated with increased RAP
(52,53). Increased pulsatility in portal venous flow has been
associated with a higher N-terminal pro–brain natriuretic
peptide (54), higher systolic pulmonary artery pressures
(55), positive fluid balance (56), and RV dysfunction
(56,57). Portal vein flow alterations can be quantified by the
pulsatility fraction (100[(Vmax2Vmin)/Vmax]); a pulsatility
fraction $30% is considered mild, whereas $50% is considered severely elevated (54).In a landmark study by Beaubien-Souligny et
al. (54), a portal vein pulsatility fraction of > 50% and severe
alterations in intrarenal venous flow (IRVF) were associated
with an increased risk of AKI in patients who underwent
cardiac surgery. The inclusion of portal vein Doppler significantly improved AKI risk prediction. Furthermore,
alterations in portal vein flow have been associated with
the development of congestive hepatopathy (58), encephalopathy (59), and major complications in patients undergoing cardiac surgery (56), and may be a useful prognosticmarker in patients hospitalized for acute HF (60).Together, these data[above] suggest that sonographic evaluation of portal vein pulsatility could become a useful tool for the diagnosisand management of venous congestion.
In our experience, increased portal vein pulsatility fraction associated with volume overload often improves with diuretic treatment (61,62).
Although a plethoric, noncollapsible IVC indicates venous
congestion, caution must be exercised when interpreting it in
patients with cardiac conditions impeding venous return
(chronic RV dysfunction/TR, RV myocardial infarction, cardiac tamponade); these patients may be fluid responsive
despite IVC plethora (63). The evaluation of hemodynamic
AKI in these conditions can be enhanced by assessing portal
veinflow; increased portal pulsatility is suggestive of congestive AKI, which can potentially improve with decongestive
therapy (62). A case of portal vein flow normalization with
diuresis, even in the presence of persistent severe TR, is presented in Figure 7C.Portal venous flow cannot be relied upon in patients with
cirrhosis because both absent pulsatility in the presence of
severe congestion and increased pulsatility unrelated to
RAP can occur (64–67).Occasionally, portal vein pulsatility can be seen in individuals who are thin and healthy (68). Given these limitations, portal vein pulsatility fraction should not be interpreted in isolation.
A recent study evaluating IVC size and hepatic, portal, and intrarenal vein Doppler flow patterns found increased specificity using the combination of multiple POCUS markers to identify clinically significant venous congestion (69).
Intrarenal Venous Doppler
Similar to the portal vein, the flow pattern in intrarenal
(arcuate and interlobar) veins depends on the surrounding
renal parenchymal histology as much as right atrium function (70). Iida et al.(71) used Doppler imaging to evaluate
IRVF patterns in patients with HF. IRVF waveforms were
divided into three flow patterns: continuous, biphasic, and
monophasic (Figure 7D). The IRVF profile was altered by
increases in RAP, but was not associated with changes in cardiac index. The monophasic pattern was associated with significant TR. IRVF strongly correlated with clinical outcomes,
including death from cardiovascular disease or unplanned
hospitalization for HF. This correlation was independent of
RAP. Similar results were obtained by Puzzovivo and colleagues (72).Supporting the role of IRVF alterations as a marker of
venous congestion, experimental fluid expansion worsened
the IRVF pattern and correlated with less diuretic efficiency
in patients with HF with preserved ejection fraction (73). A
recent study in patients with pulmonary hypertension also
showed adverse outcomes were associated with IRVF alterations (74). Three patients from this study who developed
severe AKI with diuretic-resistant fluid overload and
required RRT exhibited a monophasic IRVF pattern.Whereas HV Doppler mainly reflects the right atrium filling pattern, portal and intrarenal venous Doppler provide
additional information about right atrial filling pressure
and its correlation with congestive organ injury (43).
Whether interventions aimed at addressing abnormal organ
flow patterns can improve relevant outcomes in patients
with venous congestion remains unknown. Moreover, the
cause-effect relationship between sonographic markers of venous congestion and AKI remains elusive at this time
and must be evaluated by larger studies. POCUS alterations
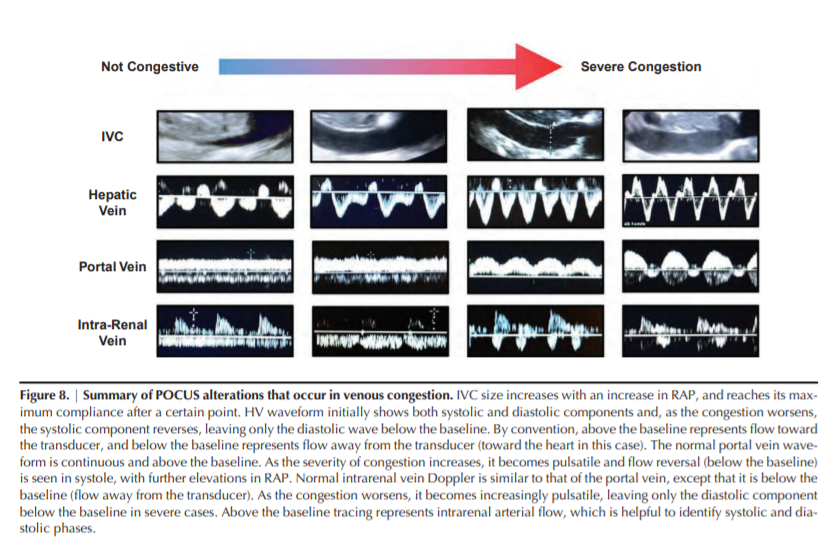
that occur in venous congestion are summarized in Figure 8.
Going Back to the Case
FOCUS revealed severely decreased LV ejection fraction
and dilated RV with significantly reduced function. Numerous
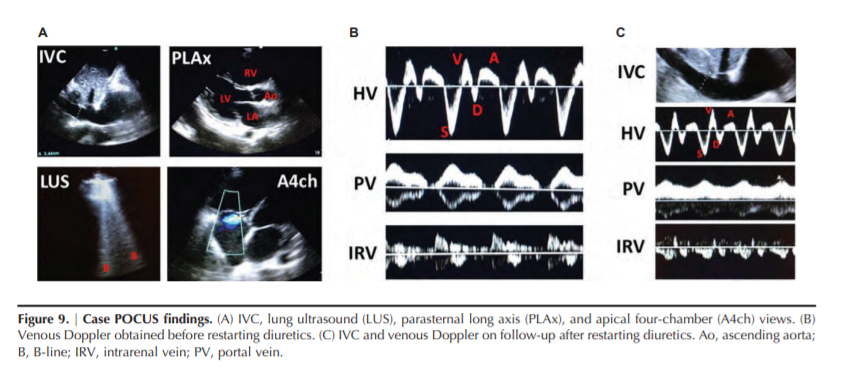
bilateral B-lines were present on LUS. IVC was 2.4 cm in diameter with no respiratory variation and there were no significant ascites (Figure 9A). These findings were compatible with HF with reduced ejection fraction and severe RV failure, and moderate pulmonary congestion.
To evaluate for the presence of systemic venous congestion, a bedside Doppler ultrasonography was performed. HV Doppler demonstrated decreased D wave amplitude (seen in severe pulmonary hypertension and abnormal RV relaxation), portal vein pulsatility fraction of 100%, and a monophasic IRVF (Figure 9B).
Although a plethoric IVC was suggestive of venous congestion, the presence of severe RV dysfunction and significant pulmonary hypertension makes it less reliable (can be chronically dilated) and the patient might still be fluid responsive. However, both portal and IRVF patterns indicated that backward transmission of RAP was significant enough to lead to abdominal organ congestion, suggesting congestive kidney injury.
Treatment and Outcome
Given these findings, diuretic therapy was restarted with
dose intensification. On follow-up, the patient showed a steady decrease in weight (approximately 10 kg) and noticeable improvement in symptoms. Although his serum creatinine worsened from 1.4 to 1.8 mg/dl initially, it improved
and stabilized at 0.6 mg/dl with continued diuresis.
Follow-up POCUS evaluation of venous congestion showed
markedly improved flow patterns on both portal vein (pulsatility fraction532% ) and IRVF (biphasic pattern) (Figure 9C)