7-05-2019 Note to myself: See the following resources that I was not aware of when I made this post.
(1) Fourth Universal Definition of Myocardial Infarction (2018) [PubMed Abstract] [Full Text HTML] [Full Text PDF]. Originally published13 Nov 2018. Circulation. 2018;138:e618–e651.
(2) What’s new in the Fourth Universal Definition of Myocardial infarction? [Full Text HTML] [Full Text PDF]. European Heart Journal, Volume 39, Issue 42, 07 November 2018, Pages 3757–3758. Here is an excerpt:
In addition to the clinical sections of the Consensus Document on
the Fourth Universal Definition of Myocardial Infarction, it also contains a considerable amount of detailed information regarding analytic issues of cTn, about the use of ECG, and the application of imaging for diagnosing myocardial injury and MI.
Resource (2) above is a great brief summary of Resource (1).
Life In The Fast Lane (an incredible emergency medicine blog) has an outstanding ECG resources. Here is the direct link to the page with links to many of the blog’s awesome resources. See also ECG References, ECG Library, ECG Basics, and ECG Clinical Interpretation. All of these are also from Life in The Fast Lane.
You can see and review examples of everything discussed below in the above resources.
I’d recommend that, as you go through each section below you look up ECG examples using the above links.
As this blog is my study notes, this post (from the Third universal definition of myocardial infarction [PubMed Abstract] [Full Text HTML] [Full Text PDF]. Eur Heart J. 2012 Oct;33(20):2551-67. doi: 10.1093/eurheartj/ehs184. Epub 2012 Aug 24) excerpts the section on electrocardiography:
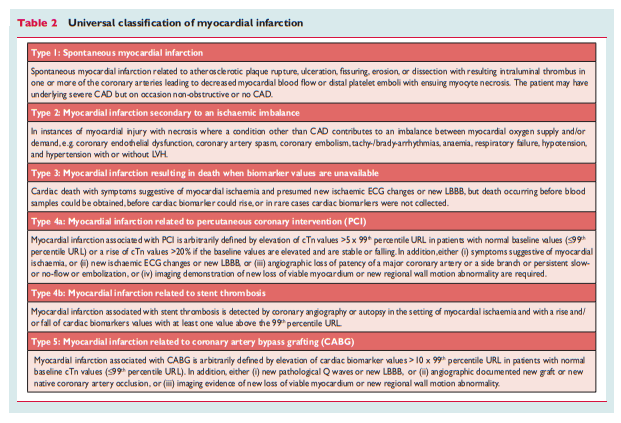
Clinical classification of myocardial infarction
For the sake of immediate treatment strategies, such as reperfusion therapy, it is usual practice to designate MI in patients with chest discomfort, or other ischaemic symptoms that develop ST elevation in two contiguous leads (see ECG section), as an ‘ST elevation MI’ (STEMI). In contrast, patients without ST elevation at presentation are usually designated as having a ‘non-ST elevation MI’ (NSTEMI). Many patients with MI develop Q waves (Q wave MI), but others do not (non-Q MI). Patients without elevated biomarker values can be diagnosed as having unstable angina. In addition to these categories, MI is classified into various types, based on pathological, clinical and prognostic differences, along with different treatment strategies (Table 2).
Electrocardiographic detection of myocardial infarction
The ECG is an integral part of the diagnostic work-up of patients with suspected MI and should be acquired and interpreted promptly (i.e. target within 10 min) after clinical presentation.2 Dynamic changes in the ECG waveforms during acute myocardial ischaemic episodes often require acquisition of multiple ECGs, particularly if the ECG at initial presentation is non-diagnostic. Serial recordings in symptomatic patients with an initial non-diagnostic ECG should be performed at 15-30 min intervals or, if available, continuous computer-assisted 12-lead ECG recording. Recurrence of symptoms after an asymptomatic interval are an indication for a repeat tracing and, in patients with evolving ECG abnormalities, a pre-discharge ECG should be acquired as a baseline for future comparison. Acute or evolving changes in the ST– T waveforms and Q waves, when present, potentially allow the clinician to time the event, to identify the infarct-related artery, to estimate the amount of myocardium at risk as well as prognosis, and to determine therapeutic strategy. More profound ST-segment shift or T wave inversion involving multiple leads/territories is associated with a greater degree of myocardial ischaemia and a worse prognosis. Other ECG signs associated with acute myocardial ischaemia include cardiac arrhythmias, intraventricular and atrioventricular conduction delays, and loss of precordial R wave amplitude. Coronary artery size and distribution of arterial segments, collateral vessels, location, extent and severity of coronary stenosis, and prior myocardial necrosis can all impact ECG manifestations of myocardial ischaemia.36 Therefore the ECG at presentation should always be compared to prior ECG tracings, when available. The ECG by itself is often insufficient to diagnose acute myocardial ischaemia or infarction, since ST deviation may be observed in other conditions, such as acute pericarditis, left ventricular hypertrophy (LVH), left bundle branch block (LBBB), Brugada syndrome, stress cardiomyopathy, and early repolarization patterns.37 Prolonged new ST-segment elevation (e.g. .20 min), particularly when associated with reciprocal ST-segment depression, usually reflects acute coronary occlusion and results in myocardial injury with necrosis. As in cardiomyopathy, Q waves may also occur due to myocardial fibrosis in the absence of CAD.
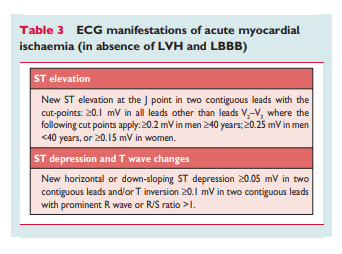
ECG abnormalities of myocardial ischaemia or infarction may be inscribed in the PR segment, the QRS complex, the ST-segment or the T wave. The earliest manifestations of myocardial ischaemia are typically T wave and ST-segment changes. Increased hyperacute T wave amplitude, with prominent symmetrical T waves in at least two contiguous leads, is an early sign that may precede the elevation of the ST segment. Transient Q waves may be observed during an episode of acute ischaemia or (rarely) during acute MI with successful reperfusion. Table 3 lists ST–T wave criteria for the diagnosis of acute myocardial ischaemia that may or may not lead to MI. The J point is used to determine the magnitude of the ST-segment shift. New, or presumed new, J point elevation ≥0.1mV is required in all leads other than V2 and V3. In healthy men under age 40, J-point elevation can be as much as 0.25 mV in leads V2 or V3, but it decreases with increasing age. Sex differences require different cut-points for women, since J point elevation in healthy women in leads V2 and V3 is less than in men.38 ‘Contiguous leads’ refers to lead groups such as anterior leads (V1 –V6), inferior leads (II, III, aVF) or lateral/apical leads (I, aVL). Supplemental leads such as V3R and V4R reflect the free wall of the right ventricle and V7–V9 the infero-basal wall.
The criteria in Table 3 require that the ST shift be present in two
or more contiguous leads. For example, ≥0.2 mV of ST elevation
in lead V2, and ≥0.1 mV in lead V1, would meet the criteria of two abnormal contiguous leads in a man >40 years old. However, ≥0.1mV and ,0.2mV of ST elevation, seen only in leads V2-V3 in men (or ,0.15mV in women), may represent a normal
finding. It should be noted that, occasionally, acute myocardial ischaemia may create sufficient ST-segment shift to meet the criteria in one lead but have slightly less than the required ST shift in a contiguous lead. Lesser degrees of ST displacement or T wave inversion do not exclude acute myocardial ischaemia or evolving MI, since a single static recording may miss the more dynamic ECG changes that might be detected with serial recordings. ST elevation or diagnostic Q waves in contiguous lead groups are more specific than ST depression in localizing the site of myocardial ischaemia or necrosis.39,40 Supplemental leads, as well as serial ECG recordings, should always be considered in patients that present with ischaemic chest pain and a non-diagnostic initial ECG.41,42Electrocardiographic evidence of myocardial ischaemia in the distribution of a left circumflex artery is often overlooked and is
best captured using posterior leads at the fifth intercostal space
(V7 at the left posterior axillary line, V8 at the left mid-scapular
line, and V9 at the left paraspinal border). Recording of these
leads is strongly recommended in patients with high clinical suspicion for acute circumflex occlusion (for example, initial ECG nondiagnostic, or ST-segment depression in leads V1 –3).41 A cut-point
of 0.05 mV ST elevation is recommended in leads V7 –V9; specificity is increased at a cut-point ≥0.1 mV ST elevation and this cutpoint should be used in men ,40 years old. ST depression in leads V1 –V3 may be suggestive of infero-basal myocardial ischaemia (posterior infarction), especially when the terminal T wave is positive (ST elevation equivalent), however this is non-specific.41 – 43 In patients with inferior and suspected right ventricular infarction, right pre-cordial leads V3R and V4R should be recorded, since ST elevation ≥0.05 mV (≥0.1 mV in men ,30 years old) provides supportive criteria for the diagnosis.42During an episode of acute chest discomfort, pseudonormalization of previously inverted T waves may indicate acute myocardial ischaemia. Pulmonary embolism, intracranial processes, electrolyte abnormalities, hypothermia, or peri-/myocarditis may also result in ST–T abnormalities and should be considered in the differential diagnosis. The diagnosis of MI is more difficult in the presence of LBBB.44,45 However, concordant ST-segment elevation or a previous ECG may be helpful to determine the presence of acute MI in this setting. In patients with right bundle branch block (RBBB), ST–T abnormalities in leads V1 –V3 are common, making it difficult to assess the presence of ischaemia in these leads: however, when new ST elevation or Q waves are found, myocardial ischaemia or infarction should be considered.
Prior myocardial infarction
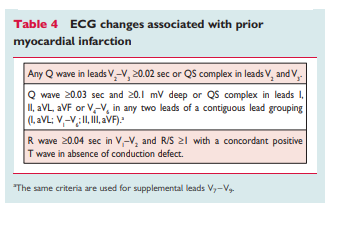
As shown in Table 4, Q waves or QS complexes in the absence of
QRS confounders are pathognomonic of a prior MI in patients with ischaemic heart disease, regardless of symptoms.46,47 The specificity of the ECG diagnosis for MI is greatest when Q waves
occur in several leads or lead groupings. When the Q waves are
associated with ST deviations or T wave changes in the same
leads, the likelihood of MI is increased; for example, minor Q waves ≥0.02 sec and ,0.03 sec that are ^ 0.1 mV deep are
suggestive of prior MI if accompanied by inverted T waves in the same lead group. Other validated MI coding algorithms, such as the Minnesota Code and WHO MONICA, have been used in epidemiological studies and clinical trials.3Silent myocardial infarction
Asymptomatic patients who develop new pathologic Q wave
criteria for MI detected during routine ECG follow-up, or reveal
evidence of MI by cardiac imaging, that cannot be directly attributed to a coronary revascularization procedure, should be termed ‘silent MI’.48 – 51 In studies, silent Q wave MI accounted for 9– 37% of all non-fatal MI events and were associated with a significantly increased mortality risk.48,49 Improper lead placement or QRS confounders may result in what appear to be new Q waves or QS complexes, as compared to a prior tracing. Thus, the diagnosis of a new silent Q wave MI should be confirmed by a repeat ECG with correct lead placement, or by an imaging study, and by focussed questioning about potential interim ischaemic symptoms.Conditions that confound the ECG diagnosis of myocardial infarction
A QS complex in lead V1 is normal. A Q wave <0.03 sec and
<25% of the R wave amplitude in lead III is normal if the frontal
QRS axis is between -30° and 0°. A Q wave may also be normal
in aVL if the frontal QRS axis is between 60° and 90. Septal Q
waves are small, non-pathological Q waves <0.03 sec and
<25% of the R-wave amplitude in leads I, aVL, aVF, and V4 –V6.
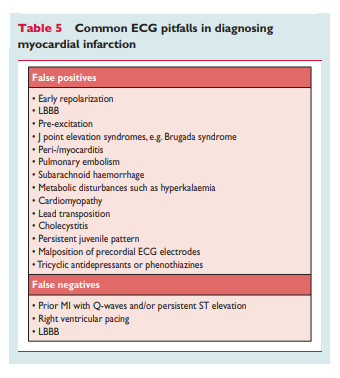
Pre-excitation, obstructive, dilated or stress cardiomyopathy,
cardiac amyloidosis, LBBB, left anterior hemiblock, LVH, right ventricular hypertrophy, myocarditis, acute cor pulmonale, or hyperkalaemia may be associated with Q waves or QS complexes in the absence of MI. ECG abnormalities that mimic myocardial ischaemia or MI are presented in Table 5.